Saying goodbye to the old Search Console
Today we are reaching another important milestone in our graduation journey, we are saying goodbye to many old Search Console reports, including the home and dashboard pages 👋. Those pages are part of the history of the web, they were viewed over a billion times by webmasters from millions of websites. These pages helped site owners and webmasters to monitor and improve their performance on Google Search for over a decade.
From now on, if you try to access the old homepage or dashboard you’ll be redirected to the relevant Search Console pages. There are only a few reports that will still be available on the old interface for now – check the Legacy tools and reports in the Help Center. We’re continuing to work on making the insights from these reports available in the new Search Console, so stay tuned!
Below is our last tribute to them, a picture of the team with the old Search Console in the background 😍. But we thought you might also have something to share, maybe some beautiful memories you have with the home and dashboard pages below (or any old Search Console page) – so we’ll be monitoring #SCmemories if you want to share your stories with us on Twitter.
 |
| Image: the team saying goodbye to the old Search Console |
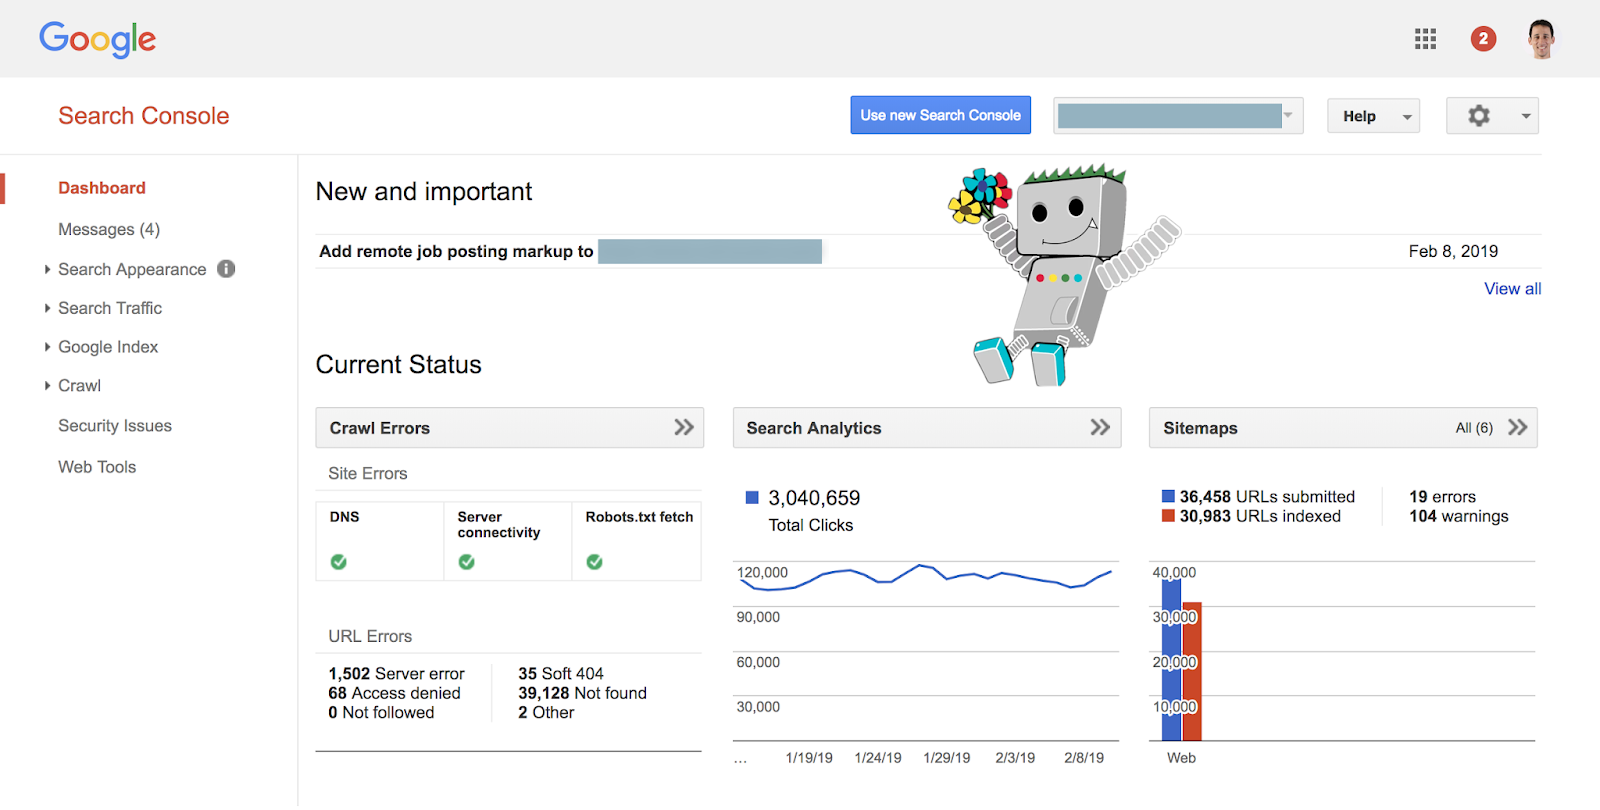 |
| Image: old Search Console dashboard |
Thank you for working together with us on making the web better – and see you at the new Search Console! If you have any feedback, let us know through the Webmasters community.
Posted by Hillel Maoz on behalf of the Search Console team.


Google: Headings Won’t Make Or Break Your Sites Rankings
Google’s John Mueller said in a Reddit thread that while “headings on a page are great for SEO & accessibility, but they’re not going to make or break your sites rankings.”
My First YouTube Subscriber Giveaway – Win Awesome SEM Stuff & Help Charities
I am doing a YouTube giveaway, where I give away free stuff for free based on if people subscribe to my YouTube channel. What am I giving away? Well, two main buckets; (A) up to $25,000 to charity and…
Tips to diversify for long-term PPC search marketing effectiveness
PPC advertisers are seeing their long-term investments lose steam, traffic, and income. Five PPC tips for advertisers and internet marketing specialists.
The post Tips to diversify for long-term PPC search marketing effectiveness appeared first on Search Engine Watch.
Content areas in Gutenberg, Twenty Twenty update and Elementor integration
It’s Monday, time for a fresh WordPress Watch. We’ve got more news on Twenty Twenty in WordPress 5.3 and there’s an update on what’s going to be the next big focus of the Gutenberg project. There’s also exciting news about the integration of two different solutions. Let’s get to it! Twenty Twenty! Last week it […]
The post Content areas in Gutenberg, Twenty Twenty update and Elementor integration appeared first on Yoast.
Now you can easily find negative keyword conflicts in Microsoft Advertising Shopping campaigns
Get a better view into product negative keyword conflicts in your Shopping campaigns.
Please visit Search Engine Land for the full article.
The old Google Search Console is no longer available
After over two years since the new version of the Google Search Console has come out, Google has finally removed access to the old version.
Please visit Search Engine Land for the full article.
Apple accused of favoring its own properties in App Store results
Apple says it has now adjusted its algorithm to reduce the visibility of the company’s apps in key categories.
Please visit Search Engine Land for the full article.
The Data You’re Using to Calculate CTR is Wrong and Here’s Why
Posted by Luca-Bares
Click Through Rate (CTR) is an important metric that’s useful for making a lot of calculations about your site’s SEO performance, from estimating revenue opportunity, prioritize keyword optimization, to the impact of SERP changes within the market. Most SEOs know the value of creating custom CTR curves for their sites to make those projections more accurate. The only problem with custom CTR curves from Google Search Console (GSC) data is that GSC is known to be a flawed tool that can give out inaccurate data. This convolutes the data we get from GSC and can make it difficult to accurately interpret the CTR curves we create from this tool. Fortunately, there are ways to help control for these inaccuracies so you get a much clearer picture of what your data says.
By carefully cleaning your data and thoughtfully implementing an analysis methodology, you can calculate CTR for your site much more accurately using 4 basic steps:
- Extract your sites keyword data from GSC — the more data you can get, the better.
- Remove biased keywords — Branded search terms can throw off your CTR curves so they should be removed.
- Find the optimal impression level for your data set — Google samples data at low impression levels so it’s important to remove keywords that Google may be inaccurately reporting at these lower levels.
- Choose your rank position methodology — No data set is perfect, so you may want to change your rank classification methodology depending on the size of your keyword set.
Let’s take a quick step back
Before getting into the nitty gritty of calculating CTR curves, it’s useful to briefly cover the simplest way to calculate CTR since we’ll still be using this principle.
To calculate CTR, download the keywords your site ranks for with click, impression, and position data. Then take the sum of clicks divided by the sum of impressions at each rank level from GSC data you’ll come out with a custom CTR curve. For more detail on actually crunching the numbers for CTR curves, you can check out this article by SEER if you’re not familiar with the process.
Where this calculation gets tricky is when you start to try to control for the bias that inherently comes with CTR data. However, even though we know it gives bad data we don’t really have many other options, so our only option is to try to eliminate as much bias as possible in our data set and be aware of some of the problems that come from using that data.
Without controlling and manipulating the data that comes from GSC, you can get results that seem illogical. For instance, you may find your curves show position 2 and 3 CTR’s having wildly larger averages than position 1. If you don’t know that data that you’re using from Search Console is flawed you might accept that data as truth and a) try to come up with hypotheses as to why the CTR curves look that way based on incorrect data, and b) create inaccurate estimates and projections based on those CTR curves.
Step 1: Pull your data
The first part of any analysis is actually pulling the data. This data ultimately comes from GSC, but there are many platforms that you can pull this data from that are better than GSC’s web extraction.
Google Search Console — The easiest platform to get the data from is from GSC itself. You can go into GSC and pull all your keyword data for the last three months. Google will automatically download a csv. file for you. The downside to this method is that GSC only exports 1,000 keywords at a time making your data size much too small for analysis. You can try to get around this by using the keyword filter for the head terms that you rank for and downloading multiple 1k files to get more data, but this process is an arduous one. Besides the other methods listed below are better and easier.
Google Data Studio — For any non-programmer looking for an easy way to get much more data from Search Console for free, this is definitely your best option. Google Data Studio connects directly to your GSC account data, but there are no limitations on the data size you can pull. For the same three month period trying to pull data from GSC where I would get 1k keywords (the max in GSC), Data Studio would give me back 200k keywords!
Google Search Console API — This takes some programming know-how, but one of the best ways to get the data you’re looking for is to connect directly to the source using their API. You’ll have much more control over the data you’re pulling and get a fairly large data set. The main setback here is you need to have the programming knowledge or resources to do so.
Keylime SEO Toolbox — If you don’t know how to program but still want access to Google’s impression and click data, then this is a great option to consider. Keylime stores historical Search Console data directly from the Search Console API so it’s as good (if not better) of an option than directly connecting to the API. It does cost $49/mo, but that’s pretty affordable considering the value of the data you’re getting.
The reason it’s important what platform you get your data from is that each one listed gives out different amounts of data. I’ve listed them here in the order of which tool gives the most data from least to most. Using GSC’s UI directly gives by far the least data, while Keylime can connect to GSC and Google Analytics to combine data to actually give you more information than the Search Console API would give you. This is good because whenever you can get more data, the more likely that the CTR averages you’re going to make for your site are going to be accurate.
Step 2: Remove keyword bias
Once you’ve pulled the data, you have to clean it. Because this data ultimately comes from Search Console we have to make sure we clean the data as best we can.
Remove branded search & knowledge graph keywords
When you create general CTR curves for non-branded search it’s important to remove all branded keywords from your data. These keywords should have high CTR’s which will throw off the averages of your non-branded searches which is why they should be removed. In addition, if you’re aware of any SERP features like knowledge graph you rank for consistently, you should try to remove those as well since we’re only calculating CTR for positions 1–10 and SERP feature keywords could throw off your averages.
Step 3: Find the optimal impression level in GSC for your data
The largest bias from Search Console data appears to come from data with low search impressions which is the data we need to try and remove. It’s not surprising that Google doesn’t accurately report low impression data since we know that Google doesn’t even include data with very low searches in GSC. For some reason Google decides to drastically over report CTR for these low impression terms. As an example, here’s an impression distribution graph I made with data from GSC for keywords that have only 1 impression and the CTR for every position.
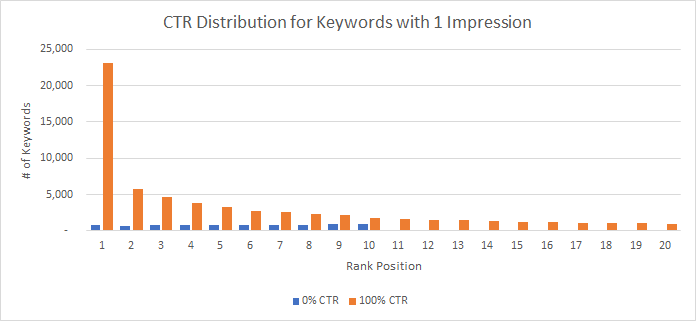
If that doesn’t make a lot of sense to you, I’m right there with you. This graph says a majority of the keywords with only one impression has 100 percent CTR. It’s extremely unlikely, no matter how good your site’s CTR is, that one impression keywords are going to get a majority of 100 percent CTR. This is especially true for keywords that rank below #1. This gives us pretty solid evidence low impression data is not to be trusted, and we should limit the number of keywords in our data with low impressions.
Step 3 a): Use normal curves to help calculate CTR
For more evidence of Google giving us biased data we can look at the distribution of CTR for all the keywords in our data set. Since we’re calculating CTR averages, the data should adhere to a Normal Bell Curve. In most cases CTR curves from GSC are highly skewed to the left with long tails which again indicates that Google reports very high CTR at low impression volumes.
If we change the minimum number of impressions for the keyword sets that we’re analyzing we end up getting closer and closer to the center of the graph. Here’s an example, below is the distribution of a site CTR in CTR increments of .001.

The graph above shows the impressions at a very low impression level, around 25 impressions. The distribution of data is mostly on the right side of this graph with a small, high concentration on the left implies that this site has a very high click-through rate. However, by increasing the impression filter to 5,000 impressions per keyword the distribution of keywords gets much much closer to the center.

This graph most likely would never be centered around 50% CTR because that’d be a very high average CTR to have, so the graph should be skewed to the left. The main issue is we don’t know how much because Google gives us sampled data. The best we can do is guess. But this raises the question, what’s the right impression level to filter my keywords out to get rid of faulty data?
One way to find the right impression level to create CTR curves is to use the above method to get a feel for when your CTR distribution is getting close to a normal distribution. A Normally Distributed set of CTR data has fewer outliers and is less likely to have a high number of misreported pieces of data from Google.
3 b): Finding the best impression level to calculate CTR for your site
You can also create impression tiers to see where there’s less variability in the data you’re analyzing instead of Normal Curves. The less variability in your estimates, the closer you’re getting to an accurate CTR curve.
Tiered CTR tables
Creating tiered CTR needs to be done for every site because the sampling from GSC for every site is different depending on the keywords you rank for. I’ve seen CTR curves vary as much as 30 percent without the proper controls added to CTR estimates. This step is important because using all of the data points in your CTR calculation can wildly offset your results. And using too few data points gives you too small of a sample size to get an accurate idea of what your CTR actually is. The key is to find that happy medium between the two.

In the tiered table above, there’s huge variability from All Impressions to >250 impressions. After that point though, the change per tier is fairly small. Greater than 750 impressions are the right level for this site because the variability among curves is fairly small as we increase impression levels in the other tiers and >750 impressions still gives us plenty of keywords in each ranking level of our data set.

When creating tiered CTR curves, it’s important to also count how much data is used to build each data point throughout the tiers. For smaller sites, you may find that you don’t have enough data to reliably calculate CTR curves, but that won’t be apparent from just looking at your tiered curves. So knowing the size of your data at each stage is important when deciding what impression level is the most accurate for your site.
Step 4: Decide which position methodology to analyze your data
Once you’ve figured out the correct impression-level you want to filter your data by you can start actually calculating CTR curves using impression, click, and position data. The problem with position data is that it’s often inaccurate, so if you have great keyword tracking it’s far better to use the data from your own tracking numbers than Google’s. Most people can’t track that many keyword positions so it’s necessary to use Google’s position data. That’s certainly possible, but it’s important to be careful with how we use their data.
How to use GSC position
One question that may come up when calculating CTR curves using GSC average positions is whether to use rounded positions or exact positions (i.e. only positions from GSC that rank exactly 1. So, ranks 1.0 or 2.0 are exact positions instead of 1.3 or 2.1 for example).
Exact position vs. rounded position
The reasoning behind using exact position is we want data that’s most likely to have been ranking in position 1 for the time period we’re measuring. Using exact position will give us the best idea of what CTR is at position 1. Exact rank keywords are more likely to have been ranking in that position for the duration of the time period you pulled keywords from. The problem is that Average Rank is an average so there’s no way to know if a keyword has ranked solidly in one place for a full time period or the average just happens to show an exact rank.
Fortunately, if we compare exact position CTR vs rounded position CTR, they’re directionally similar in terms of actual CTR estimations with enough data. The problem is that exact position can be volatile when you don’t have enough data. By using rounded positions we get much more data, so it makes sense to use rounded position when not enough data is available for exact position.

The one caveat is for position 1 CTR estimates. For every other position average rankings can pull up on a keywords average ranking position and at the same time they can pull down the average. Meaning that if a keyword has an average ranking of 3. It could have ranked #1 and #5 at some point and the average was 3. However, for #1 ranks, the average can only be brought down which means that the CTR for a keyword is always going to be reported lower than reality if you use rounded position.
A rank position hybrid: Adjusted exact position
So if you have enough data, only use exact position for position 1. For smaller sites, you can use adjusted exact position. Since Google gives averages up to two decimal points, one way to get more “exact position” #1s is to include all keywords which rank below position 1.1. I find this gets a couple hundred extra keywords which makes my data more reliable.
And this also shouldn’t pull down our average much at all, since GSC is somewhat inaccurate with how it reports Average Ranking. At Wayfair, we use STAT as our keyword rank tracking tool and after comparing the difference between GSC average rankings with average rankings from STAT the rankings near #1 position are close, but not 100 percent accurate. Once you start going farther down in rankings the difference between STAT and GSC become larger, so watch out how far down in the rankings you go to include more keywords in your data set.

I’ve done this analysis for all the rankings tracked on Wayfair and I found the lower the position, the less closely rankings matched between the two tools. So Google isn’t giving great rankings data, but it’s close enough near the #1 position, that I’m comfortable using adjusted exact position to increase my data set without worrying about sacrificing data quality within reason.
Conclusion
GSC is an imperfect tool, but it gives SEOs the best information we have to understand an individual site’s click performance in the SERPs. Since we know that GSC is going to throw us a few curveballs with the data it provides its important to control as many pieces of that data as possible. The main ways to do so is to choose your ideal data extraction source, get rid of low impression keywords, and use the right rank rounding methods. If you do all of these things you’re much more likely to get more accurate, consistent CTR curves on your own site.
Sign up for The Moz Top 10, a semimonthly mailer updating you on the top ten hottest pieces of SEO news, tips, and rad links uncovered by the Moz team. Think of it as your exclusive digest of stuff you don’t have time to hunt down but want to read!
Google’s Move toward Paid Inclusion
While you discover the latest major Google search changes, you may notice the big push to show local-ish organic results for your searches. If you aren’t sure, manipulate your IP address to be around a nearby city you know, search for something commercial “brand coffee machine”, and watch the results change to include stores around […]
Majestic’s enhanced tool now gives SEOs a lot more useful context about backlinks
New “link context” visualizes where the link appears on the page, the surrounding text and associated link density.
Please visit Search Engine Land for the full article.
Change log: Google updated its Search Quality Rater Guidelines
Here’s what’s new, compared side-by-side with the last version.
Please visit Search Engine Land for the full article.
The Transformation of Search Summit 2019: Speakers, agenda, FAQ
The Transformation of Search Summit 2019 will take place in New York on Oct. 25. Speakers include experts from Disney, Pinterest, Mastercard, and Microsoft.
The post The Transformation of Search Summit 2019: Speakers, agenda, FAQ appeared first on Search Engine Watch.
Google Local Maps Search Results Drops Pagination – A Bug?
If you go to Google Maps, search for a service in a locale, Google will not let you go to page two of those results. Instead, Google will just stop showing you results and ask you to “see web results” for more. Previously, Google would let you click t…
Google Has New Movie & TV Search Experience & New Developer Docs For Movie Schema
Google yesterday announced two movie and TV related things yesterday and they were not directly related. First Google launched a new mobile experience for searching for movies or shows. Second Google has new developer documents for movie structured da…
Google Hotel Results Now Displays Distance To Attractions
A lot of local SEOs are talking about how Google’s hotel search results now are showing searchers how far away a specific hotel is from an attraction you are looking to visit. Gus Pelogia posted a screen shot on Twitter of this and I think it is new.
…
Google Search Showing Orgies For Things To Do In Dallas
Joe Youngblood shared a screen shot of Google showing orgy parties as an option for a query on [what to do in dallas tonight?] This worked yesterday and I am not sure I blame Google for showing it, it was a data feed from EventBright, and someone pla…
Search Buzz Video Recap: Google Search Algorithm Update, Crawl Spikes, Mobile Indexing, Movie Listings, Maps & More
This week in search I covered a possible Google search ranking update that touched down on September 4th or 5th. Before that we saw a spike in crawling activity from GoogleBot. I also posted the monthly Google Webmaster Report…
Lessons I have learned from adding FAQ schema: A test of 1,000 keywords
FAQ snippets take more space in SERP and that can keep you on top.
Please visit Search Engine Land for the full article.
Learn to think like an SEO developer
Enhance your skill set by bringing your SEO knowledge to the world of computer programming.
Please visit Search Engine Land for the full article.