Evaluating page experience for a better web
Through both internal studies and industry research, users show they prefer sites with a great page experience. In recent years, Search has added a variety of user experience criteria, such as how quickly pages load and mobile-friendliness, as factors for ranking results. Earlier this month, the Chrome team announced Core Web Vitals, a set of metrics related to speed, responsiveness and visual stability, to help site owners measure user experience on the web.
Today, we’re building on this work and providing an early look at an upcoming Search ranking change that incorporates these page experience metrics. We will introduce a new signal that combines Core Web Vitals with our existing signals for page experience to provide a holistic picture of the quality of a user’s experience on a web page.
As part of this update, we’ll also incorporate the page experience metrics into our ranking criteria for the Top Stories feature in Search on mobile, and remove the AMP requirement from Top Stories eligibility. Google continues to support AMP, and will continue to link to AMP pages when available. We’ve also updated our developer tools to help site owners optimize their page experience.
A note on timing: We recognize many site owners are rightfully placing their focus on responding to the effects of COVID-19. The ranking changes described in this post will not happen before next year, and we will provide at least six months notice before they’re rolled out. We’re providing the tools now to get you started (and because site owners have consistently requested to know about ranking changes as early as possible), but there is no immediate need to take action.
About page experience
The page experience signal measures aspects of how users perceive the experience of interacting with a web page. Optimizing for these factors makes the web more delightful for users across all web browsers and surfaces, and helps sites evolve towards user expectations on mobile. We believe this will contribute to business success on the web as users grow more engaged and can transact with less friction.
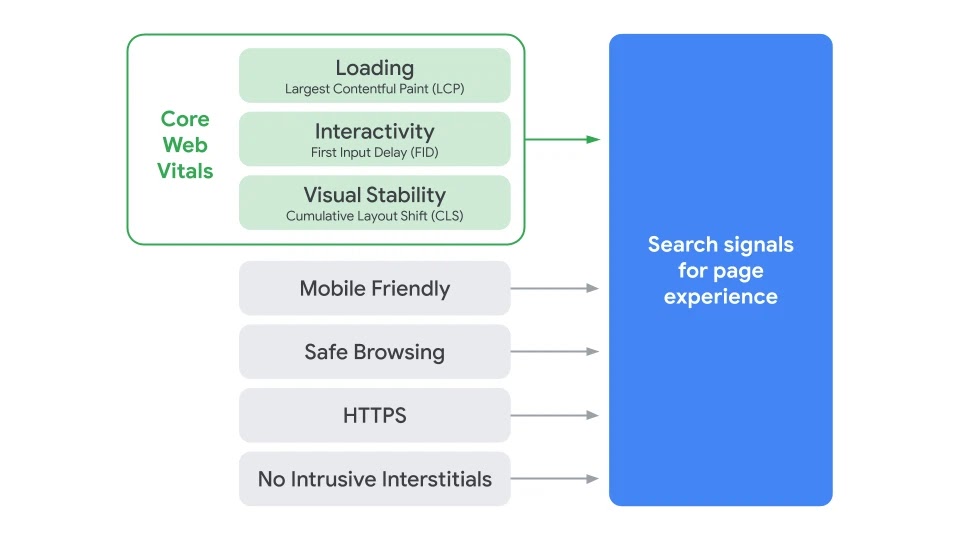
Core Web Vitals are a set of real-world, user-centered metrics that quantify key aspects of the user experience. They measure dimensions of web usability such as load time, interactivity, and the stability of content as it loads (so you don’t accidentally tap that button when it shifts under your finger – how annoying!).
We’re combining the signals derived from Core Web Vitals with our existing Search signals for page experience, including mobile-friendliness, safe-browsing, HTTPS-security, and intrusive interstitial guidelines, to provide a holistic picture of page experience. Because we continue to work on identifying and measuring aspects of page experience, we plan to incorporate more page experience signals on a yearly basis to both further align with evolving user expectations and increase the aspects of user experience that we can measure.
Page experience ranking
Great page experiences enable people to get more done and engage more deeply; in contrast, a bad page experience could stand in the way of a person being able to find the valuable information on a page. By adding page experience to the hundreds of signals that Google considers when ranking search results, we aim to help people more easily access the information and web pages they’re looking for, and support site owners in providing an experience users enjoy.
For some developers, understanding how their sites measure on the Core Web Vitals—and addressing noted issues—will require some work. To help out, we’ve updated popular developer tools such as Lighthouse and PageSpeed Insights to surface Core Web Vitals information and recommendations, and Google Search Console provides a dedicated report to help site owners quickly identify opportunities for improvement. We’re also working with external tool developers to bring Core Web Vitals into their offerings.
While all of the components of page experience are important, we will prioritize pages with the best information overall, even if some aspects of page experience are subpar. A good page experience doesn’t override having great, relevant content. However, in cases where there are multiple pages that have similar content, page experience becomes much more important for visibility in Search.
Page experience and the mobile Top Stories feature
The mobile Top Stories feature is a premier fresh content experience in Search that currently emphasizes AMP results, which have been optimized to exhibit a good page experience. Over the past several years, Top Stories has inspired new thinking about the ways we could promote better page experiences across the web.
When we roll out the page experience ranking update, we will also update the eligibility criteria for the Top Stories experience. AMP will no longer be necessary for stories to be featured in Top Stories on mobile; it will be open to any page. Alongside this change, page experience will become a ranking factor in Top Stories, in addition to the many factors assessed. As before, pages must meet the Google News content policies to be eligible. Site owners who currently publish pages as AMP, or with an AMP version, will see no change in behavior – the AMP version will be what’s linked from Top Stories.
Summary
We believe user engagement will improve as experiences on the web get better — and that by incorporating these new signals into Search, we’ll help make the web better for everyone. We hope that sharing our roadmap for the page experience updates and launching supporting tools ahead of time will help the diverse ecosystem of web creators, developers, and businesses to improve and deliver more delightful user experiences.
Please stay tuned for our future updates that will communicate more specific guidance on the timing for these changes to come into effect. As always, if you have any questions or feedback, please visit our webmaster forums.
Posted by Sowmya Subramanian, Director of Engineering for Search Ecosystem

Helping publishers and users get more out of visual searches on Google Images with AMP
Google Images has made a series of changes to help people explore, learn and do more through visual search. An important element of visual search is the ability for users to scan many ideas before coming to a decision, whether it’s purchasing a product, learning more about a stylish room, or finding instructions for a DIY project. Often this involves loading many web pages, which can slow down a search considerably and prevent users from completing a task.
As previewed at Google I/O, we’re launching a new AMP-powered feature in Google Images on the mobile web, Swipe to Visit, which makes it faster and easier for users to browse and visit web pages. After a Google Images user selects an image to view on a mobile device, they will get a preview of the website header, which can be easily swiped up to load the web page instantly.

Swipe to Visit uses AMP’s prerender capability to show a preview of the page displayed at the bottom of the screen. When a user swipes up on the preview, the web page is displayed instantly and the publisher receives a pageview. The speed and ease of this experience makes it more likely for users to visit a publisher’s site, while still allowing users to continue their browsing session.
Publishers who support AMP don’t need to take any additional action for their sites to appear in Swipe to Visit on Google Images. Publishers who don’t support AMP can learn more about getting started with AMP here. In the coming weeks, publishers can also view their traffic data from AMP in Google Images in a Search Console’s performance report for Google Images in a new search area named “AMP on Image result”.
We look forward to continuing to support the Google Images ecosystem with features that help users and publishers alike.
Posted by Assaf Broitman, Google Images PM
User experience improvements with page speed in mobile search
To help users find the answers to their questions faster, we included page speed as a ranking factor for mobile searches in 2018. Since then, we’ve observed improvements on many pages across the web. We want to recognize the performance improvements webmasters have made over the past year. A few highlights:
- For the slowest one-third of traffic, we saw user-centric performance metrics improve by 15% to 20% in 2018. As a comparison, no improvement was seen in 2017.
- We observed improvements across the whole web ecosystem. On a per country basis, more than 95% of countries had improved speeds.
- When a page is slow to load, users are more likely to abandon the navigation. Thanks to these speed improvements, we’ve observed a 20% reduction in abandonment rate for navigations initiated from Search, a metric that site owners can now also measure via the Network Error Logging API available in Chrome.
- In 2018, developers ran over a billion PageSpeed Insights audits to identify performance optimization opportunities for over 200 million unique urls.
Great work and thank you! We encourage all webmasters to optimize their sites’ user experience. If you’re unsure how your pages are performing, the following tools and documents can be useful:
- PageSpeed Insights provides page analysis and optimization recommendations.
- Google Chrome User Experience Report provides the user experience metrics for how real-world Chrome users experience popular destinations on the web.
- Documentation on performance on Web Fundamentals.
For any questions, feel free to drop by our help forums (like the webmaster community) to chat with other experts.
Posted by Genqing Wu and Doantam Phan
PageSpeed Insights, now powered by Lighthouse
At Google, we know that speed matters and we provide a variety of tools to help everyone understand the performance of a page or site. Historically, these tools have used different analysis engines. Unfortunately, this caused some confusion because the…
Using page speed in mobile search ranking
People want to be able to find answers to their questions as fast as possible — studies show that people really care about the speed of a page. Although speed has been used in ranking for some time, that signal was focused on desktop searches. Today we’re announcing that starting in July 2018, page speed will be a ranking factor for mobile searches.
The “Speed Update,” as we’re calling it, will only affect pages that deliver the slowest experience to users and will only affect a small percentage of queries. It applies the same standard to all pages, regardless of the technology used to build the page. The intent of the search query is still a very strong signal, so a slow page may still rank highly if it has great, relevant content.
We encourage developers to think broadly how about performance affects a user’s experience of their page and to consider a variety of user experience metrics. Although there is no tool that directly indicates whether a page is affected by this new ranking factor, here are some resources that can be used to evaluate a page’s performance.
- Chrome User Experience Report, a public dataset of key user experience metrics for popular destinations on the web, as experienced by Chrome users under real-world conditions
- Lighthouse, an automated tool and a part of Chrome Developer Tools for auditing the quality (performance, accessibility, and more) of web pages
- PageSpeed Insights, a tool that indicates how well a page performs on the Chrome UX Report and suggests performance optimizations
As always, if you have any questions or feedback, please visit our webmaster forums.
Posted by Zhiheng Wang and Doantam Phan
Real-world data in PageSpeed Insights
PageSpeed Insights provides information about how well a page adheres to a set of best practices. In the past, these recommendations were presented without the context of how fast the page performed in the real world, which made it hard to understand when it was appropriate to apply these optimizations. Today, we’re announcing that PageSpeed Insights will use data from the Chrome User Experience Report to make better recommendations for developers and the optimization score has been tuned to be more aligned with the real-world data.
The PSI report now has several different elements:
- The Speed score categorizes a page as being Fast, Average, or Slow. This is determined by looking at the median value of two metrics: First Contentful Paint (FCP) and DOM Content Loaded (DCL). If both metrics are in the top one-third of their category, the page is considered fast.
- The Optimization score categorizes a page as being Good, Medium, or Low by estimating its performance headroom. The calculation assumes that a developer wants to keep the same appearance and functionality of the page.
- The Page Load Distributions section presents how this page’s FCP and DCL events are distributed in the data set. These events are categorized as Fast (top third), Average (middle third), and Slow (bottom third) by comparing to all events in the Chrome User Experience Report.
- The Page Stats section describes the round trips required to load the page’s render-blocking resources, the total bytes used by the page, and how it compares to the median number of round trips and bytes used in the dataset. It can indicate if the page might be faster if the developer modifies the appearance and functionality of the page.
- Optimization Suggestions is a list of best practices that could be applied to this page. If the page is fast, these suggestions are hidden by default, as the page is already in the top third of all pages in the data set.
For more details on these changes, see About PageSpeed Insights. As always, if you have any questions or feedback, please visit our forums and please remember to include the URL that is being evaluated.
Posted by Mushan Yang (杨沐杉) and Xiangyu Luo (罗翔宇), Software Engineers