Google: HTML Sitemaps Can Help But Are They Necessary?
Personally, I am a fan of having HTML Sitemaps – mostly for 404 like pages, so users who stumble on a page they are forbidden (sounds strict) to access, they have a way out but not out of your web site…
Google To Users: Control Your Privacy & Security
Some Google users, including myself, are seeing a new popup at the top right of Google.com when you are logged into Google. The pop up reads, “Control your privacy and security. Click your profile icon to access your Google account…
Why Is There A Leap Day? Today’s Google Doodle Sheds Light On Leap Year’s Extra Day
Google’s Leap Day logo leads to search results aimed explaining why we get an extra day every four years.
The post Why Is There A Leap Day? Today’s Google Doodle Sheds Light On Leap Year’s Extra Day appeared first on Search Engine Land.
Please visit Search Engine Land for the full article.
What is HTTP/2 and why should we care?
The web is about to get faster, with the introduction of the latest version of the HTTP protocol: HTTP/2.
The Google Analytics Add-On for Sheets: An Intro to an Underutilized Tool
Posted by tian_wang
With today’s blog post I’m sharing everything one needs to know about an underappreciated tool: the Google Analytics add-on for Google Sheets. In this post I’ll be covering the following:
1. What is the Google Analytics add-on?
2. How to install and set up the Google Analytics add-on.
3. How to create a custom report with the Google Analytics add-on.
4. A step-by-step worked example of setting up an automated report.
5. Further considerations and pitfalls to avoid.
Thanks to Moz for having me, and for giving me the chance to write about this simple and powerful tool!
1. What is the Google Analytics add-on and why should I care?
I’m glad I asked. Simply put, the Google Analytics add-on is an extension for Google Sheets that allows you to create custom reports within Sheets. The add-on works by linking up to an existing Analytics account, using Google’s Analytics API and Regular Expressions to filter the data you want to pull, and finally gathering the data into an easy and intuitive format that’s ripe for reporting.
The Google Analytics add-on’s real value-add to a reporting workflow is that it’s extremely flexible, reliable, and a real time-saver. Your reporting will still be constrained by the limitations of Sheets itself (as compared to, say, Excel), but the Sheets framework has served almost every reporting need I’ve come across to date and the same will probably be true for most of you!
In a nutshell, the Add-On allows you to:
- Pull any data that you’d be able to access in the Analytics API (i.e analytics.google.com) directly into a spreadsheet
- Easily compare historical data across time periods
- Filter and segment your data
- Automate regular reporting
- Make tweaks to existing reports to get new data (no more re-inventing wheels!)
If this all sounds like you could use it, read on!
2. Getting started: How to install and set up the Google Analytics add-on
2A. Installing the Google Analytics add-on
- Go into Google Sheets.
- On the header bar, under your Workbook’s title, click add-on.

- This opens a drop-down menu — click “Get add-ons.”
- In the following window, type “Google Analytics” into the search bar on the top right and hit enter.

- The first result is the add-on we want, so go ahead and install it.
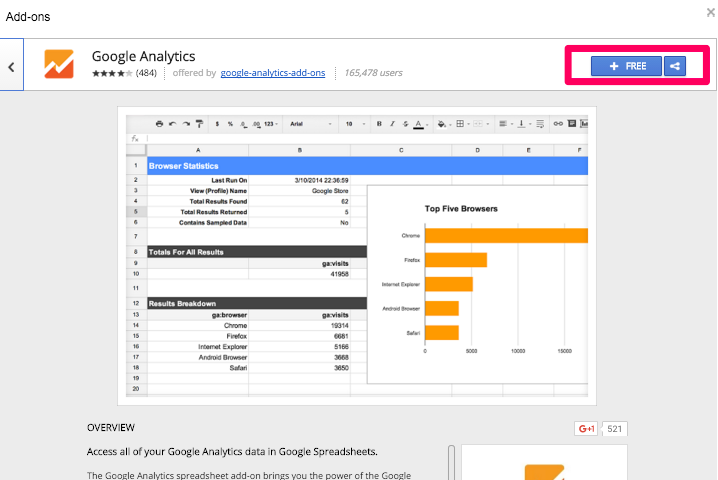
- Refresh your page and confirm the add-on is installed by clicking “Add-ons” again. You should see an option for “Google Analytics.”

That’s all there is to installation!
2B. Setting up the Google Analytics add-on
Now that we have the Google Analytics add-on installed, we need to set it up by linking it to an Analytics account before we can use it.
- Under the “Add-ons” tab in Sheets, hover “Google Analytics” to expose a side-bar as shown below.

- Click “Create New Report.” You’ll see a menu appear on the right side of your screen.

- In this menu, set the account information to the Analytics account you want to measure.
- Fill out the metrics and dimensions you want to analyze. You can further customize segmentation within the report itself later, so just choose a simple set for now.
- Click “Create Report.” The output will be a new sheet, with a report configuration that looks like this:

- Note: This is NOT your report. This is the setup configuration for you to let the add-on know exactly what information you’d like to see in the report.
Once you’ve arrived at this step, your set-up phase is done!
Next we’ll look at what these parameters mean, and how to customize them to tailor the data you receive.
3. Creating a custom report with the Google Analytics add-on
So now you have all these weird boxes and you’re probably wondering what you need to fill out and what you don’t.
Before we get into that, let’s take a look at what happens if you don’t fill out anything additional, and just run the report from here.
To run a configured report, click back into the “Add-Ons” menu and go to Google Analytics. From there, click “Run Reports.” Make sure you have your configuration sheet open when you do this!

You’ll get a notification that the report was either successfully created, or that something went wrong (this might require some troubleshooting).
Following the example above, your output will look something like this:

This is your actual report. Hooray! So what are we actually seeing? Let’s go back to the “Report Configuration” sheet to find out.
The report configuration:

Type and View ID are defaults that don’t need to be changed. Report Name is what you want your report to be called, and will be the name generated for the report sheet created when you run your reports.
So really, in the report configuration above, all the input we’re seeing is:
- Last N Days = 7
- Metrics = ga:users
In other words, this report shows the total number of sessions in the specified View ID over the last week. Interesting maybe, but not that helpful. Let’s see what happens if we make a few changes.

I’ve changed Last N Days from 7 to 30, and added Date as a Dimension. Running the report again yields the following output:

By increasing the range of data pulled from last 7 to 30 days, we get a data from a larger set of days. By adding date as a dimension, we can see how much traffic the site registered each day.
This is only scratching the surface of what the Google Analytics add-on can do. Here’s a breakdown of the parameters, and how to use them:
|
Parameter Name |
Required? |
Description & Notes |
Example Value(s) |
|---|---|---|---|
|
Report Name |
No |
The name of your report. This will be the name of the report sheet that’s generated when you run reports. If you’re running multiple reports, and want to exclude one without deleting its configuration setup, delete the report name and the column will be ignored next time you run your reports. |
“January Organic Traffic” |
|
Type |
No |
Inputs are either “core” or “mcf,” representative of Google’s Core Reporting API and Multi-Channel Funnels API respectively. Core is the default and will serve most of your needs! |
“core” / “mcf” |
|
View (Profile) ID |
Yes |
The Analytics view that your report will pull data from. You can find your view ID in the Analytics interface, under the Admin tab. |
ga:12345678 |
|
Start / End Date |
No |
Used alternatively with Last N Days (i.e you must use exactly one), allows you to specify a range of data to pull from. |
2/1/2016 – 2/31/2016 |
|
Last N Days |
No |
Used alternatively with Start / End Date (i.e you must use exactly one), pulls data from the last N days from the current date. Counts backwards from the current date. |
Any integer |
|
Metrics |
Yes |
Metrics you want to pull. You can include multiple metrics per report. Documentation on Metrics and dimensions can be found in Google’s Metrics & Dimensions Explorer |
“ga:sessions” |
|
Dimensions |
No |
Dimensions you want your metrics to be segmented by. You can include multiple dimensions per report. Documentation on metrics and dimensions can be found here. |
“ga:date” |
|
Sort |
No |
Specifies an order to return your data by, can be used to organize data before generating a report. Note: you can only sort by metrics/dimensions that are included in your report. |
“sort=ga:browser, |
|
Filters |
No |
Filter the data included in your report based on any dimension (not just those included in the report). |
“ga:country==Japan; |
|
Segment |
No |
Use segments from the main reporting interface. |
“users::condition:: |
|
Sampling Level |
No |
Directs the level of sampling for the data you’re pulling. Analytics samples data by default, but the add-on can increase the precision of sampling usage. |
“HIGHER_PRECISION” |
|
Start Index |
No |
Shows results starting from the current index (default = 1, not 0). For use with Max Results, when you want to retrieve paginated data (e.g if you’re pulling 2,000 results, and want to get results 1,001 – 2,000). |
Integer |
|
Max Results |
No |
Default is 1,000, can be raised to 10,000. |
Integer up to 10,000 |
|
Spreadsheet URL |
No |
Sends your data to another spreadsheet. |
URL for sheet where you want data to be sent |
By using these parameters in concert, you can arrive at a customized report detailing exactly what you want. The best part is, once you’ve set up a report in your configuration sheet and confirmed the output is what you want, all you have to do to run it again is run your reports in the add-on! This makes regular reporting a breeze, while still bringing all the benefits of Sheets to bear.
Some important things to note and consider, when you’re setting up your configuration sheet:
- You can include multiple report configurations in the the sheet (see below):

In the image above, running the report configuration will produce four separate reports. You should NOT have one configuration sheet per report.
- Although you can have your reports generated in the same workbook as your configuration sheet, I recommend copying the data into another workbook or using the Spreadsheet URL parameter to do the same thing. Loading multiple reports in one workbook can create performance problems.
- You can schedule your reporting to run automatically by enabling scheduled reporting within the Google Analytics add-on. Note: this is only helpful if you are using “Last N Days” for your time parameter. If you’re using a date range, your report will just give you the same data for that range every month.

The regularity options are hourly, daily, weekly, and monthly.
4. Creating an automated report: A worked example
So now that we’ve installed, set up, and configured a report, next up is the big fish, the dream of anyone who’s had to do regular reporting: automation.
As an SEO, I use the Google Analytics add-on for this exact purpose for many of my clients. I’ll start by assuming you’ve installed and set up the add-on, and are ready to create a custom report configuration.
Step one: Outline a framework
Before we begin creating our report, it’s important we understand what we want to measure and how we want to measure it. For this example, let’s say we want to view organic traffic to a specific set of pages on our site from Chrome browsers and that we want to analyze the traffic month-over-month and year-over-year.
Step two: Understand your framework within the add-on
To get everything we want, we’ll use three separate reports: organic traffic in the past month (January 2016), organic traffic in the month before that (December 2015), and organic traffic in the past month, last year (January 2015). It’s possible to include this all in one report, but I recommend creating one report per date period, as it makes organizing your data and troubleshooting your configuration significantly easier.
Step three: Map your key elements to add-on parameters

Report One parameter breakdown:
Report Name – 1/1/2016
- Make it easily distinguishable from the other reports we’ll be running
Type – core
- The GA API default
View (Profile) ID
- The account we want to pull data from
Start Date – 1/1/2016
- The beginning date we want to pull data from
End Date – 1/31/2016
- The cutoff date for the data we want to pull
Metrics – ga:sessions
- We want to analyze sessions for this report
Dimensions – ga:date
- Allows us to see traffic the site received each day in the specified range
Filters – ga:medium==organic;ga:landingpagepath=@resources
- We’ve included two filters, one that specifies only organic traffic and another that specifies sessions that had a landing page with “resources” in the URL (resources is the subdirectory on Distilled’s website that houses our editorial content)
- Properly filling out filters and segments requires specific syntax, which you can find on Google’s Core Reporting API resources.
Segments – sessions::condition::ga:browser==Chrome
- Specifies that we only want session data from Chrome browsers
Sampling Level – HIGHER_PRECISION
- Specifies that we want to minimize sampling for this data set
Report One output: Past month’s sessions
Now that we’ve set up our report, it’s time to run it and check the results.

So, in the month of January 2016, the resources section on Distilled’s website saw 10,365 sessions that satisfied the following conditions:
- organic source/medium
- landing page containing “resources”
- Chrome browser
But how do we know this is accurate? It’s impossible to tell at face value, but you can reliably check accuracy of a report by looking at the analogous view in Google Analytics itself.
Confirming Report One data
Since the Google Analytics add-on is an analogue to what you find on analytics.google.com, in your account, we can combine separate pieces in GA to achieve the same effect as our report:
Date Range

Organic Source/Medium

Landing Page Path & Browser

The result

Hooray!
Now that we’ve confirmed our framework works, and is showing us what we want, creating our other two reports can be done by simply copying the configuration and making minor adjustments to the parameters.

Since we want a month-over-month comparison and a year-over-year comparison for the exact same data, all we have to do is change the date range for the two reports.
One should detail the month before (December 2015) and the other should detail the same month in the previous year (January 2015). We can run these reports immediately.
The results?
Total Sessions In January 2015 (Reporting Month, Previous Year: 2,608
Total Sessions In December 2015 (Previous Month): 7,765
Total Sessions In January 2016 (Reporting Month): 10,365
We’re up 33% month-over-month and 297% year-over-year. Not bad!
Every month, we can update the dates in the configuration. For example, next month we’ll be examining February 2016, compared to January 2016 and February 2015. Constructing a dashboard can be done in Sheets, as well, by creating an additional sheet that references the outputs from your reports!
5. Closing observations and pitfalls to avoid
The Google Analytics add-on probably isn’t the perfect reporting solution that all digital marketers yearn for. When I first discovered the Google Analytics add-on for Google Sheets, I was intimidated by its use of Regular Expressions and thought that you needed to be a syntax savant to make full use of the tool. Since then, I haven’t become any better at Regular Expressions, but I’ve come to realize that the Google Analytics add-on is versatile enough that it can add value to most reporting processes, without the need for deep technical fluency.
I was able to cobble together each of the reports I needed by testing, breaking, and researching different combinations of segments, filters, and frameworks and I encourage you to do the same! You’ll most likely be able to arrive at the exact report you need, given enough time and patience.
One last thing to note: the Google Analytics interface (i.e what you use when you access your analytics account online) has built-in safeguards to ensure that the data you see matches the reporting level you’ve chosen. For example, if I click into a session-level report (e.g landing pages), I’ll see mostly session-level metrics. Similarly, clicking into a page-level report will return page-level metrics. In the Google Analytics add-on, however, this safeguard doesn’t exist due to the add-on being designed for greater versatility. It’s therefore all the more important that you’re thorough in outlining, designing, and building your reporting framework within the add-on. After you’ve configured a custom report and successfully run it, be sure to check your results against the Google Analytics interface!
Abraham Lincoln famously said, “Give me six hours to chop down a tree and I will spend the first four sharpening the axe.” Good advice in general that also holds true for using the Google Analytics add-on for Google Sheets.
Supplementary resource appendix:
- Kristi Hines’ Google Analytics for Beginners guide – See title.
- Google’s Analytics Core Reporting API Documentation – Dig around here to find out how to build reports that give you exactly what you’re looking for!
- Avinash Kaushik’s Analytics Resource – Discusses the Google Analytics reporting framework and how to think about metrics and sessions.
- RegExr – General Regular Expressions resource.
- Debuggex – Visual Regular Expressions debugging tool.
Sign up for The Moz Top 10, a semimonthly mailer updating you on the top ten hottest pieces of SEO news, tips, and rad links uncovered by the Moz team. Think of it as your exclusive digest of stuff you don’t have time to hunt down but want to read!
SearchCap: Google AdWords & Bing Ads Bugs, AMP Ranking Signal & Review Stars Bug
Below is what happened in search today, as reported on Search Engine Land and from other places across the web.
The post SearchCap: Google AdWords & Bing Ads Bugs, AMP Ranking Signal & Review Stars Bug appeared first on Search Engine Land.
Please visit Search Engine Land for the full article.
Google: AMP Not A Ranking Signal Yet
As you know, Google launched AMP in the mobile search results this week.
Back in December…
Google AdWords Download Or Print Reports Broken
There is a bug in Google AdWords that will prevent you from downloading or printing reports from the AdWords console. I tested it myself and I received the following error:
There was an error with your operation. If you were trying to make a change…..
Video Recap of Weekly Search Buzz :: February 26, 2016
This week in search, we had Google go live with the AMP pages in the mobile search results this Tuesday. Google said that AMP is not yet a ranking signal. Google is sending AMP error alerts in the Search Console. Google has removed AdWords ads on the …
Review Stars, Zen and the Art of Local Search
A very brief history: Rich Snippet review stars have had a tough week. Starting last Wednesday I noticed they were missing on a few searches. By Friday, the reports of their disappearance were widespread. Interestingly not all instances of the review stars disappeared, even during the “darkest” hour. Many in the industry were asking about them … Continue reading Review Stars, Zen and the Art of Local Search →
Related posts:
Prioritizing Local Search Profile Listings: 2 Methods
Looking to start building those citations for local SEO? Columnist Lydia Jorden shares her strategy for determining which local business listing sites are worth investing in.
The post Prioritizing Local Search Profile Listings: 2 Methods appeared firs…
Search In Pics: Coca Cola Google Cardboard, Googley Volvo & Animated Google Sign
In this week’s Search In Pictures, here are the latest images culled from the web, showing what people eat at the search engine companies, how they play, who they meet, where they speak, what toys they have and more. View From Google’s San Francisco Office: Source: Google+ GIF: Google…
Please visit Search Engine Land for the full article.
Google Confirms Review Stars’ Mysterious Disappearance In Search Results Was A Bug
Google review snippets are now back after a bug that caused them to drop out of much of the search results for about a week.
The post Google Confirms Review Stars’ Mysterious Disappearance In Search Results Was A Bug appeared first on Search Engine Land.
Please visit Search Engine Land for the full article.
Connecting Demographics To Search Queries
Frustrated by the lack of demographic data available for search ads? Contributor Andrew Ruegger shares his method for obtaining demographic information at the keyword level.
The post Connecting Demographics To Search Queries appeared first on Search E…
Google: AMP Not Yet A Search Ranking Signal
In December, Google said AMP might become a ranking signal. It is not yet, but it still may become a ranking factor when it is more widely launched.
The post Google: AMP Not Yet A Search Ranking Signal appeared first on Search Engine Land.
Please vis…
Google App Updates Will Include New Animations & Ability To Change Google Logo Colors
9to5Google.com reports users will be able to change the color of Google logo using a “finger painting-like” feature.
The post Google App Updates Will Include New Animations & Ability To Change Google Logo Colors appeared first on Search Engine Land.
Please visit Search Engine Land for the full article.
AdWords And Bing Ads Both Having Late-Week Reporting Troubles
Issues began Thursday for both platforms and continue to affect reporting on Friday.
The post AdWords And Bing Ads Both Having Late-Week Reporting Troubles appeared first on Search Engine Land.
Please visit Search Engine Land for the full article.
Top Stories With AMP Section Added To Structured Data Google Developer Docs
Google has added a new section to the structured data developer documents named Top Stories With AMP. The page pretty much describes how and where AMP stories show, which is in the top stories news carousel in the mobile search results…
Google’s Chrome Link Was Nofollowed & Discounted
Yesterday we reported that Google bought a link for $350,000 but explained it was a sponsorship and the intent was not to manipulate the search results.
Google’s John Mueller addressed this case in a Google+ hangout this morning. “It is a weird situa…
Google Sends Notices To Fix Errors On Your AMP Pages
Google is sending errors via the Google Search Console to those who set up AMP pages to “fix errors on your AMP pages.” The error reads:
Google systems have detected that some of your AMP pages do not meet our guidelines and will therefore not show i…