The 2017 Local SEO Forecast: 10 Predictions According to Mozzers
Posted by MiriamEllis
Maybe it takes a bit of daring to forecast local search developments in quarters 2, 3, and 4 from the fresh heights of Q1, but the Moz team thrives on challenges. In this post, Rand Fishkin, Dr. Pete Meyers, George Freitag, Britney Muller, and I peer into the future in hopes of helping your local business or local search marketing agency be mentally and tactically prepared for an exciting ride in the year ahead.
1. There will be a major shakeup in local SEO ranking factors.
 |
Rand Fishkin, Founder & Wizard of Moz |
My prediction is that the local SEO ranking factors will have a major shakeup, possibly devaluing some of the long-held elements around listing consistency from hard-to-control third parties. I think Google might make this move because, while they perceive the quality and trustworthiness of those third-party local data aggregators to be decent, they don’t want to force small business owners into maintaining contentious relationships or requiring them to learn about these services that control so much of their ranking fate. I’ll be the first to say this is a bold prediction, and I don’t give it super-high odds, but I think even if it doesn’t happen in 2017, it’s likely in the next few years.
2. Feature diversification will continue to mature.
 |
Dr. Peter J. Myers, Marketing Scientist at Moz |
I predict that local SEO will finally see the kind of full-on feature diversification (organic and paid) that has been going on with organic for a few years now. We’ve already seen many changes to local packs and the introduction of local knowledge panels, including sponsored hotel panels. Now Google is testing paid home services, ads in local packs, destination carousels, trip planning guides and, most recently, “Discover More Places” map results. By the end of 2017, “local SEO” will represent a wide variety of organic and paid opportunities, each with their own unique costs and benefits. This will present both new opportunities and new complications.
3. Voice search will influence features in Google and Amazon results.
 |
George Freitag, Local Search Evangelist at Moz |
I also think we’ll see a new wave of features appear in the local pack over the next year. I believe that voice search will play a large part in this as it will determine the most important features that Google (and Amazon) will incorporate into their results. As both companies start to gather more and more data about the types of complex searches — like “How long will it take me to get there?” or something more ambitious like “Do they have any more of those in my size” — Google and Amazon will start to facilitate businesses in answering those questions by allowing more opportunities to directly submit information. This satisfies both Google’s desire to have even more data submitted directly to them and the searcher’s desire to have access to more information about the businesses, which means it’s something that is definitely worth their time.
4. Google will begin to provide incredibly specific details about local businesses.
 |
Britney Muller, SEO & Content Architect at Moz |
I predict that we will see Google acquiring more intimate details about local businesses. They will obtain details from your customers (via different incentives) for unbiased feedback about your business. This will help Google provide searchers with a better user experience. We’ve already started seeing this with “Popular Times” and the “Live” features, showing you if current traffic is under or over the typical amount for the specific location. Your location’s level of noise, coziness, bedside manner (for doctors and clinics), and even how clean the bathroom is will all become accessible to searchers in the near future.
5–10. Six predictions for the price of one!
 |
Miriam Ellis, Moz Associate & Local SEO |
I have a half-dozen predictions for the coming year:
Diminishing free packs
Google paid packs will have replaced many free packs by 2017’s end, prompting local business owners to pay to play, particularly in the service industries that will find themselves having to give Google a piece of the pie in exchange for leads.
Voice search will rise
Local marketers will need to stress voice search optimization to business owners. Basically, much of this will boil down to including more natural language in the site’s contents and tags. This is a positive, in that our industry has stressed natural language over robotic-sounding over-optimization for many years. Voice search is the latest incentive to really perfect the voice of your content so that it matches the voice your customers are using when they search. Near-me searches and micro-moment events tie in nicely to the rise of voice search.
Expansion of attributes
Expect much discussion of attributes this year as Google rolls out further attribute refinements in the Google My Business dashboard, and as more Google-based reviewers find themselves prompted to assign attributes to their sentiments about local businesses.
Ethical businesses will thrive
Ongoing study of the millennial market will cement the understanding that serving this consumer base means devoting resources to aspirational and ethical business practices. The Internet has created a segment of the population that can see the good and bad of brands at the click of a link, and who base purchasing decisions on that data. Smart brands will implement sustainable practices that guard the environment and the well-being of workers if they want millennial market share.
Google will remain dominant
What won’t happen this year is a major transfer of power from the current structure. Google will remain dominant, but Facebook will continue to give them the best run for their money. Apple Maps will become more familiar to the industry. Yelp will keep building beyond the 115 million reviews they’ve achieved and more retail business owners will realize Yelp is even bigger for their model than it is for restaurants. You’ve pretty much got to be on Yelp in 2017 if you are in the retail, restaurant, or home service industries.
Amazon’s local impact will increase
Amazon’s ingress into local commerce will almost certainly result in many local business models becoming aware of the giant coming to town, especially in metropolitan communities. I’m withholding judgement on how successful some of their programs (like Amazon Go) will be, but local business owners need to familiarize themselves with these developments and see what’s applicable to them. David Mihm recently mentioned that he wouldn’t be surprised to see Amazon buying a few bankrupt malls this year — that wouldn’t surprise me, either.
Taken in sum, it’s a safe bet that local SEO is going to continue to be a significant force in the world of search in the coming year. Local business owners and the agencies which serve them will be wise to stay apprised of developments, diversifying tactics as need arises.
Now it’s your turn! Do you agree/disagree with our predictions? And how about your forecast? When you look to the future in local, what do you foresee? Please help us round out this post with predictions from our incredibly smart community.
Sign up for The Moz Top 10, a semimonthly mailer updating you on the top ten hottest pieces of SEO news, tips, and rad links uncovered by the Moz team. Think of it as your exclusive digest of stuff you don’t have time to hunt down but want to read!
SearchCap: Google algorithm changes, Google Maps lists & people also ask
Below is what happened in search today, as reported on Search Engine Land and from other places across the web.
The post SearchCap: Google algorithm changes, Google Maps lists & people also ask appeared first on Search Engine Land.
Please visit Search Engine Land for the full article.
Ranking Local Businesses Based Upon Quality Measures including Travel Time
Can the amount of travel time someone might take to get to a place be a good indication of the quality of that place? That is the assumption behind a recently granted patent from Google. Travel time in the patent is referred to as a “time investment a person may be willing to make to […]
The post Ranking Local Businesses Based Upon Quality Measures including Travel Time appeared first on SEO by the Sea.
Google: No comment on possibility of a Feb. 7 algorithm update
Did your rankings in Google get better or worse over the past week? Many webmasters and SEOs are noticing some significant changes in Google’s search rankings algorithm.
The post Google: No comment on possibility of a Feb. 7 algorithm update appeared …
7 tips for small manufacturers thinking about using AdWords
New to AdWords? Feeling intimidated? In this helpful how-to, columnist Dianna Huff explains how to start small with AdWords so that you can be successful, even if you’ve never done a paid search campaign before.
The post 7 tips for small manufacturers…
‘Things to do near me’ SEO
Columnist Andrew Shotland takes a look at the “near me” phenomenon and shares data that helps illuminate how to rank for these queries.
The post ‘Things to do near me’ SEO appeared first on Search Engine Land.
Please visit Search Engine Land for the full article.
How do the recent updates to Google Data Studio benefit marketers?
In a slew of recent posts on their Analytics blog, Google has announced a number of important updates for its Data Studio tool. So what is Google Data Studio, why has Google focused so much attention on improving it, and what benefits does it provide for marketers?
Google Maps new feature lets users create lists of saved places that can be shared & accessed offline
Users can keep track of saved places and share lists with others via text, email and popular messaging apps.
The post Google Maps new feature lets users create lists of saved places that can be shared & accessed offline appeared first on Search Engine Land.
Please visit Search Engine Land for the full article.
Ask Yoast: stop words in your focus keyword?
If you want people to easily find your website, you should start by picking the right focus keywords (the keyword or keyphrase you’d like to rank for). Sometimes it can be hard to decide which keywords to optimize for. Do you have to focus on a head or a long tail keyword? Do you have […]
What Does Machine Learning and AI Really Mean for SEO?
Artificial Intelligence and Machine Learning (ML) are not brand new concepts but over the last few years we’ve started to hear an awful lot more about how those technologies are in use by search engine companies. Google uses Machine Learning to help determine things like the quality of a webpage and the meaning of search […]
The post What Does Machine Learning and AI Really Mean for SEO? appeared first on Builtvisible.
What is a pangolin? Google Valentine’s Day doodle series & pangolin game come to desktop
After launching its first Valentine’s Day doodle two days ago on mobile, Google is now sharing the doodle and its accompanying game on desktop.
The post What is a pangolin? Google Valentine’s Day doodle series & pangolin game come to desktop appeared first on Search Engine Land.
Please visit Search Engine Land for the full article.
Google’s ‘people also ask’ search feature officially gains dynamic loading
Google’s people also ask feature has gained a new way for searchers to explore topics in the desktop and mobile search results.
The post Google’s ‘people also ask’ search feature officially gains dynamic loading appeared first on Search Engine Land.
Please visit Search Engine Land for the full article.
What Is A Pangolin – Google Valentine’s Day Logo
Today on Google’s home page is a series of Google logo Doodle games…
Google Fast Track Indexing Vs. Normal Indexing
Google’s John Mueller in a video hangout last Friday at the 1:04 mark into the video addressed the common question of why does a page or URL show up in Google’s index for a couple days or so and then drop out…
Google Launches Dynamic Loading People Also Ask
Last November we reported Google was testing a dynamic loading people also ask feature. Well…
Google Analytics Starts Rolling Out New User Interface
Last week, I personally saw my Google Analytics user interface flip from the old user interface to the new one they announced was coming back in October. I then started getting emails and tweets…
February 7th Google Algorithm Update Was Big
Last week, I reported about a Google update that touched down on Tuesday, February 7th. Well…
What is influencer marketing, and why should it be part of your digital strategy?
If I tell you I have the secret formula for any entrepreneur to succeed, you may not believe me. But if Neil Patel, New York Times best selling author and a person The Wall Street Journal calls ‘the web’s top influencer’ tells you, “My secret formula is the greatest”, you will probably believe him.
How to Uncover Hidden Keyword-Level Data Using Google Sheets
Posted by SarahLively
TL;DR
Keyword-level data isn’t gone, it’s just harder to get to. By using Google Sheets to marry the data from Search Console and Google Analytics into a sheet, you’ll have your top keywords and landing page engagement metrics together (for free!). It’s not perfect keyword-level data, but in 7 steps you can see the keywords that drove clicks to a page and the organic engagement metrics for that page, all together in one place. The Google Analytics Add-on for Google Sheets will pull organic landing page engagement metrics, and the Search Analytics for Sheets Add-on will pull the top queries by landing page from Search Console. Then, use VLOOKUP and an Array Formula to combine the data into a new tab that has your specified landing pages, the keywords that drove clicks there, and the specified engagement metrics.
What do you mean you don’t know which keyword drove that conversion?
Since the disappearance of keyword-level data in Google Analytics, SEOs have been struggling to tie keyword strategies to legitimate, measurable metrics. We put much of our time, resources, and research efforts into picking the perfect keyword theme, full of topically relevant terms that leverage new semantic strategies. We make sure to craft the perfect metadata, positioning our top keywords in the right place in the title tag and integrating them seamlessly into the meta description, but then what? We monitor rankings and look to landing page metrics, but all of our data is disjointed and we’re left to extrapolate insights based on a limited understanding of how our themes are truly performing.
There is good news, though! Keyword-level data is still there — it’s just much harder to get to given the structure of existing platforms. If you’re like me, you have your landing page metrics in Google Analytics, your keyword click data in Search Console, and your keyword themes in a manual program (probably Excel). Given the way Google Analytics exports data, the way Search Console separates keywords and landing pages, and the nuances you’ve applied to your own keyword theme documents, it’s difficult to marry all of the data in a way that gives you actionable insights and real-time data monitoring capabilities.
Difficult… but not impossible. Enter: Google Sheets. In 7 easy steps you can pull all of this data into one sheet so you can see your keyword theme, the keywords you’re getting clicks for, the page ranking, and any organic metric for that page (think engagement metrics, conversion metrics, revenue metrics, etc.), all in one place! You can monitor keyword opportunities within striking distance, whether the keywords you want to rank for are actually ranking, and what terms and themes are driving the majority of your revenue or conversions. At the end of the day all of this works to give you actionable metrics you can monitor and change through keyword strategies. It’s much easier than you may think, and the steps below will get you started.
Follow this guide to build out a basic Google Sheet that ties Search Console, Google Analytics, and your keyword theme into one place for a few pages, and then you’ll be well on your way to building out automated sheets that give you greater insight into keyword-level data!
Step 1: Get the Google Analytics and Search Analytics for Sheets Add-ons
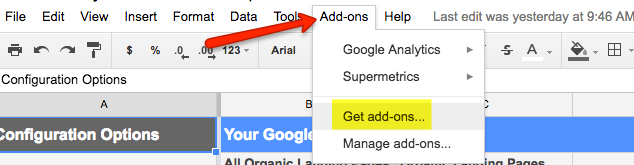
The Google Analytics Add-on will allow you to pull any metric from Google Analytics into your spreadsheet and Search Analytics for Sheets will pull data from Search Console. Pulling from these two sources will be the key to combining the data from Google Analytics and the Search Analytics report in a meaningful way. Once you have a new sheet open and you’re in the add-on feature, finding and installing Google Analytics and Search Analytics for Sheets should be pretty straightforward. Also, both add-ons are free.
Step 2: Create Google Analytics reports
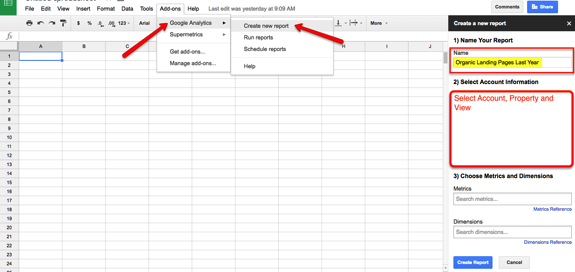
Once you’ve installed the Google Analytics add-on, you’ll find “Google Analytics” in your menu. Hover over Google Analytics and select Create new report to get started. After the sidebar menu pops in, select the Account, Property, and View that you want to pull data from. You will also be able to name your report (see note below) and then select Create Report. You do not have to worry about the metrics and dimensions at this point, but that will come later.
Note: At the end of this article I have a template you can use to combine the data from Google Analytics and Search Analytics. If you want to use the template, make sure you name this first report Organic Landing Pages Last Year. I will also walk through the formulas and functions used in this article, so you don’t have to rely on the template, but the nomenclature of each tab must be consistent to use my exact formulas. There are plenty of opportunities to rename the report and tabs, so don’t stress if you miss this part and name your report something different; just know that if at the end the template isn’t working, you should double-check the tab names.
Step 3: Configure your Google Analytics reports
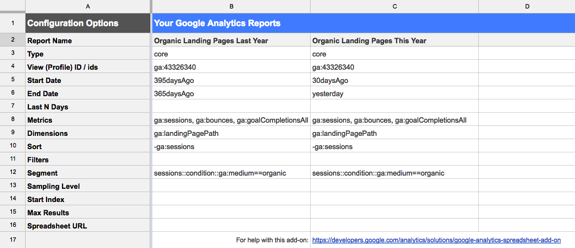
The Report Configuration tab you now see as the first tab in your sheet is where you can configure the data you want to pull. I highly recommend familiarizing yourself with this functionality by watching this quick, five-minute video from Google as an overview on how to generate reports from Google Analytics in Google Sheets. Listed below are the fields being used for this report, and you can find an extensive overview of what all of these fields mean and the metrics you can use within them here: https://developers.google.com/analytics/solutions/google-analytics-spreadsheet-add-on.
Note: If you prefer to simply fill in your sheet and read the details on each field configuration later, you can paste the cells below into your table at cell B5 (just double-check it looks like the screenshot above) and skip down to the last paragraph in this section, right after Segments.
| 395daysAgo |
| 365daysAgo |
| ga:sessions, ga:bounces, ga:goalCompletionsAll |
| ga:landingPagePath |
| -ga:sessions |
| sessions::condition::ga:medium==organic |
Report Name:
The name you set when you created the report. This can be changed, but note that when you run your report, the tab with your report will use this report name.
Type:
This will automatically fill in “core” for you, meaning we are pulling from the Core Reporting API.
View:
This will also automatically fill in your Profile ID, which you set when you created the report.
Start Date:
To compare the last 30 days to the same 30 days the previous year, we will set the Start Date as 395daysAgo
End Date:
To compare a full 30 days last year to a full 30 days this year, we will set the End Date as 365daysAgo
Metrics:
This refers to the metrics you want to pull and will dictate the columns you see in your report. For this report we want to look at sessions, bounces, and goal completions, so we are using the metrics ga:sessions, ga:bounces, ga:goalCompletionsAll. Google has an excellent tool for searching possible metrics here (https://developers.google.com/analytics/devguides/reporting/core/dimsmets) if you want to eventually test and pull anything other than sessions, bounce rate, and goal completions.
Dimensions:
Dimensions refers to the dimensions you want to see specific metrics for; in this case, landing pages. We’re using landing pages as the dimension because this will allow us to match Search Analytics landing page query data with landing page Google Analytics. To pull the metrics you selected above by landing page, use ga:landingPagePath
Sort:
The Google Analytics API will default to sort your metrics in ascending order. For me, it’s more valuable to see the top landing pages in descending order so I can get a quick look at the pages driving the most traffic to my site. To do this, you simply place a minus (-) sign before the metric you want to sort your date by: -ga:sessions. You can learn more about sorting metrics through the Google Analytics API here: https://developers.google.com/analytics/devguides/reporting/core/v3/reference#sort.
Segments:
The last field we’re going to be adding to is Segments so we can look at just organic traffic. This is where you could put in new organic users, return organic users, or any special segment you’ve created in Google Analytics. However, for this report we’re going to use the primary organic traffic segment that’s standard in Google Analytics: sessions::condition::ga:medium==organic.
As mentioned, we want to see organic traffic to each page during the last 30 days compared to the previous year. To do this, we need to generate two reports: one with our session data for the last 30 days, and one for the session data for the same span of time one year ago. We have 2015 ready to go, so simply paste that into column C, rename the Report Name to Organic Landing Pages This Year and change Start Date to 30daysAgo and End Date to yesterday. Double-check the screenshot above matches your configurations before moving on.
Step 4: Run your Google Analytics report
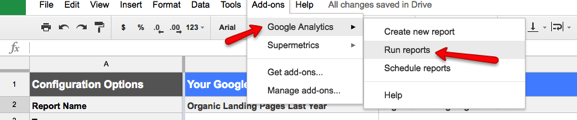
You will run the report you just created by selecting Run reports under the Google Analytics add-on. We won’t be reviewing scheduling reports in this article, but it can be useful to time these to run on a specific day to align with any ongoing reporting you have. You can learn more about scheduling reports here: https://developers.google.com/analytics/solutions/google-analytics-spreadsheet-add-on#scheduling-reports.
If everything has been completed correctly so far, you should see this popup:
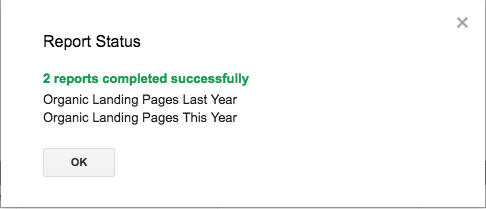
If, for some reason, you see a popup noting that you have an error, Google Analytics is great at letting you know exactly which field has been implemented incorrectly. Double-check your segments here (https://developers.google.com/analytics/devguides/reporting/core/v3/reference) and as long as you’re using valid formatting, you should be able to fix any issues.
Assuming everything went according to plan, you’ll see a spreadsheet that looks like this:
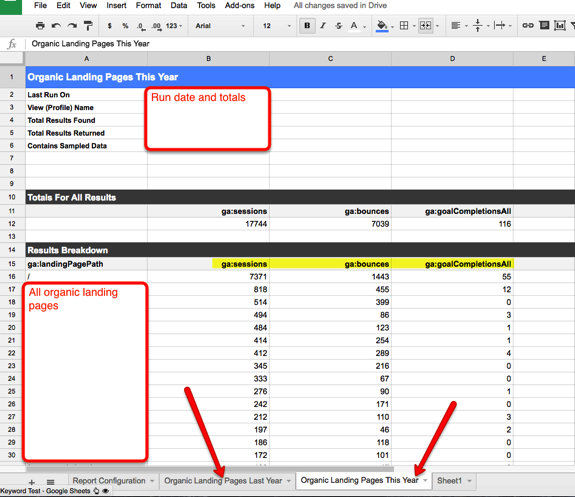
Step 5: Run your Search Analytics for Sheets report
Running a Search Analytics for Sheets report is really simple. Click to your empty sheet (Sheet1), and in the same place you were able to launch Google Analytics, launch the sidebar for Search Analytics for Sheets. From there, you’ll authorize the app and set the parameters of your report. Any metrics that I updated are highlighted in the screenshot below, but you want to group by query and page, aggregate by page, and have the results display on the active sheet. The default for Search Analytics for Sheets is to pull from the previous 90 days, but you can adjust this to display whatever makes sense for your website.
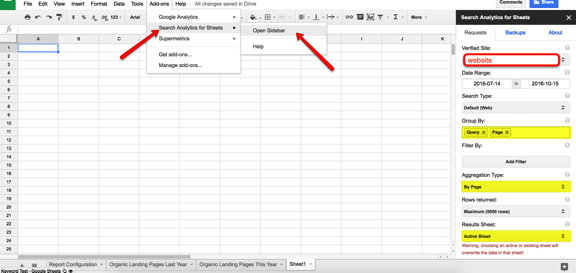
As long as everything runs correctly, you’ll see your top search queries, landing pages, clicks, impressions, CTR, and average position in descending order by clicks. Rename Sheet1 to Search Console Data, and your sheet should look like this:
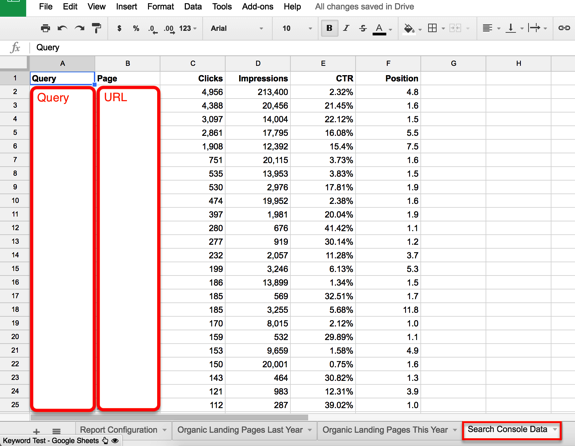
Step 6: Remove the domain name from Search Analytics landing pages
Hopefully you can see where this is going now. We have one tab with all of our Google Analytics data by landing page, and one with our Search Analytics data by landing page, so all that’s left is to marry the data.
First, we just need to strip the domain name from the Search Console data. You’ll notice the data from Google Analytics pulls the top landing pages excluding the https://domain-name.com, and Search Console pulls the entire domain.Therefore, we have to format them identically in order to combine the data. To do this, you’ll need to execute a “find and replace” on your Page column in the Search Console tab in Google Sheets and replace https://domain-name.com with no replacement (eliminating the domain name from the URL).
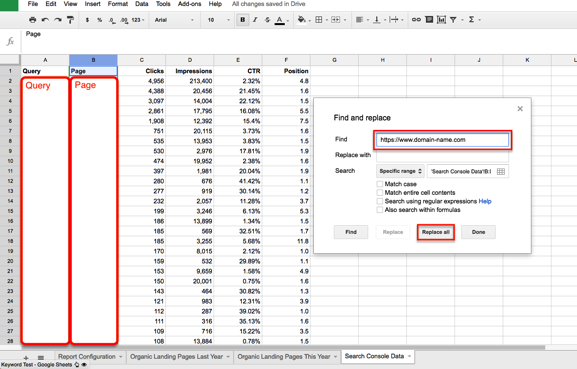
Step 7: Combine the data
Download the Keyword Level Data template here. This template has the proper formulas in place to pull landing page sessions year over year, bounce rate, and total goal conversions. I’ve also set Column C up as “Target Keywords” to type in the terms you’re actively targeting on each page. This way, you can see if what you’re targeting is similar to what you’re ranking for in Google. Once the template is up, copy the Keyword Data tab to your worksheet.
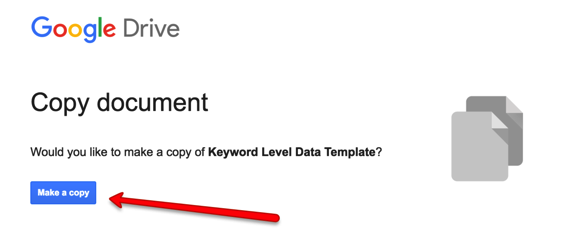
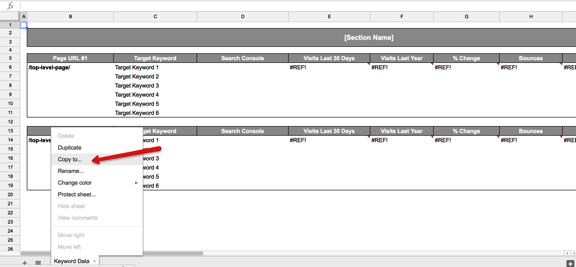
After you copy the sheet over, you should see a new sheet with a tab called Keyword Data. From here, select the Keyword Data tab and click Copy to…
Select the sheet you have built with your data, and a copy of the Keyword Data tab will populate at the end of your sheet.
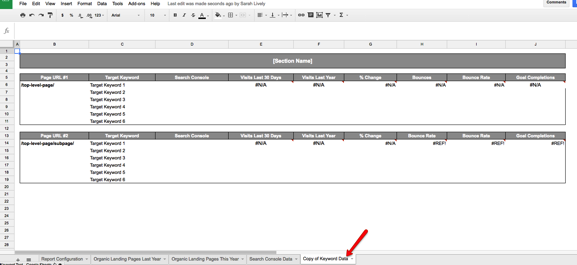
If you’ve done everything correctly so far, you will be able to update your URLs and the data will automatically appear within the template for your specific pages. When adding your page URL, be sure not to include the domain name. For example, if you wanted to see data for https://www.domain-name.com/products/, you would type /products/ in cell B6 and see the data populate. Also make sure everything is matching up with trailing slashes between your Google Analytics data and your Search Console data. If you have issues with duplicate URL structures, you may need to work with the data a bit to make the URL structure formatting consistent (and also you should fix that on the server side!). Your results should look something like this:
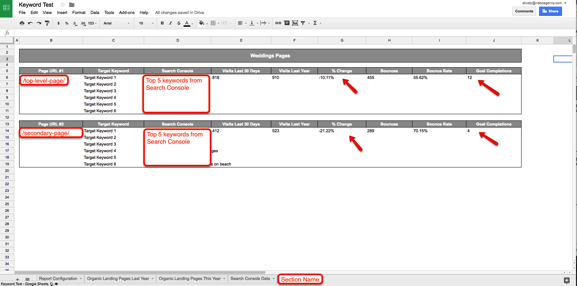
How is the template working?
If you’re interested in looking at more than two pages and really building this out into a more robust report, you probably want to understand what formulas are controlling the results so you can expand the data.
The majority of this template utilizes VLOOKUP to pull the Google Analytics data into the sheet. If you’re not sure how VLOOKUP works, you can read more on that here.

The year-over-year percent change column and bounce rate column are simple calculations. For example, the percent change in cell G6 is calculated using =(E6-F6)/F6 and the bounce rate in cell I6 uses =(H6/E6). You’re probably familiar with these common Excel functions already.
The more complicated formula is the array formula that’s being used to pull the keyword data from Search Analytics. Due to the fact that a VLOOKUP will stop after the first match, and we want to see up to five matches for queries, we’re utilizing an array formula instead to pull the matches in up to 5 cells. There are other functions that will do this as well (pull all possible matches in a sheet, that is); however, the array formula is unique in that it lets us limit the results to five rows (otherwise, if you have 10 matches for one term but 4 for another, you wouldn’t be able to structure your sheet in way that displays multiple pages within one tab).
Here is the array formula that’s used in cell D6:
=ArrayFormula(IF(ISERROR(INDEX(‘Search Console Data’!$A$1:$B$5000,SMALL(IF(‘Search Console Data’!$B$1:$B$5000=$B$6,ROW(‘Search Console Data’!$A$1:$B$5000)),ROW(2:2)),1)),””,INDEX(‘Search Console Data’!$A$1:$B$5000,SMALL(IF(‘Search Console Data’!$B$1:$B$5000=$B$6,ROW(‘Search Console Data’!$B$1:$B$5000)),ROW(2:2)),1)))
This formula is allowing multiple values to pull for the value in B6, but also allows the formula to drag down and expand through cell D11. The array formula in cell D11 is:
=ArrayFormula(IF(ISERROR(INDEX(‘Search Console Data’!$A$1:$B$5000,SMALL(IF(‘Search Console Data’!$B$1:$B$5000=$B$6,ROW(‘Search Console Data’!$A$1:$B$5000)),ROW(7:7)),1)),””,INDEX(‘Search Console Data’!$A$1:$B$5000,SMALL(IF(‘Search Console Data’!$B$1:$B$5000=$B$6,ROW(‘Search Console Data’!$B$1:$B$5000)),ROW(7:7)),1)))
You can learn more about array formulas here, but the way they are executed in Google Sheets is a bit different than Excel. From my research, this formula gave the results I wanted (multiple matches controlled in a specific set of cells), but if you know of a function in Google Sheets that does something similar, feel free to share in the comments!
Conclusion
Keyword-level data isn’t gone! Google is giving us valuable insights into what terms are leading users to our sites — we just need to combine the data in a meaningful way. Google Sheets is a powerful way to connect to various APIs and pull loads of data from multiple sources. There are some limitations to the Search Analytics report (see this great post from Russ Jones on some inaccuracies he found in Search Console Search Analytics data), so hopefully this small sheet will inspire you to expand the data and include more engagement metrics from Google Analytics, additional click data from Search Console, rankings data, data for traffic outside of organic, and more. Not to mention all of this can be scheduled, so you can have your Search Analytics and Google Analytics data ready when you open your sheets and automate almost this entire process.
We don’t have to use tools like Search Console and Google Analytics in a vacuum simply because they exist that way. Experiment with ways to combine the data on your own to gain more valuable insights into your campaigns!
Also, if you loved this, if any of this doesn’t work for you, if you know paid tools that do this, you’re doing this a different way, you’re doing this in a bigger way, or this just didn’t make sense to you — comment! I would love to hear how other SEOs are gleaning insights into keyword data in the new days of (not provided) and improve on this process with your help!
Shout outs
A special shout out goes to @mihaiaperghis for publishing this blog post on How to Use Search Analytics in Google Sheets for Better SEO Insights as I was finishing up this post. Thanks to your post, I was able to find a free, easy way to pull from the Search Analytics API into sheets. Before reading, I was utilizing and wrote about a paid add-on that was ~$30/month, so thanks to your post I can call this entire process free. Also thanks to @SWallaceSEO for reviewing this article, testing the sheet, and helping me with edits and debugging!
Sign up for The Moz Top 10, a semimonthly mailer updating you on the top ten hottest pieces of SEO news, tips, and rad links uncovered by the Moz team. Think of it as your exclusive digest of stuff you don’t have time to hunt down but want to read!
Google May Check to See if People Go to Geographic Locations Google May Recommend
Google was granted a patent this week to enable them to check whether people are following recommendations in search results to visit geographical locations – to see how many people actually visited those places. And it’s probably good for many businesses to have Google recommending that people visit them. For example, people living near a […]
The post Google May Check to See if People Go to Geographic Locations Google May Recommend appeared first on SEO by the Sea.