What does Web 3.0 mean for search?
The phrase “Web 3.0” was first coined back in 2006. Viewed by some industry insiders back then as an “unobtainable dream”, the idea of Web 3.0 has remained elusive. However, as technology evolves, the dream seems much more obtainable than ever before. In fact, many argue it is already a reality.
Ask Yoast: Breadcrumbs for products in multiple categories
It’s important to have breadcrumbs on your website. They show users how a page fits into the structure of a site, and allow search engines to determine the site’s structure. But how do you go about implementing breadcrumbs when you have many products that fit into more than one category? In this Ask Yoast, I’ll […]
The post Ask Yoast: Breadcrumbs for products in multiple categories appeared first on Yoast.
4 Steps to Performing a Social Media Content Audit
_(1).jpg)
Conducting a social media content audit is an important part of a social media marketing plan, as it reveals strengths and weaknesses of the activity you are carrying out across your marketing channels.
SEO David vs. Goliath: How travel sector minnows can overcome their big brand competitors
Perhaps the reason it intrigues me so much is the huge opportunity to grab traffic from the typical head terms, right through to capturing the long tail search queries at the awareness stage in the buying journey. Alongside this is the challenge smaller brands face competing with the giants in the market and having to get smart with leveraging search.
During this post, I want to take you through an example overview of part of the travel market and give an understanding on how smaller brands are capturing search traffic against the bigger brands in the industry.
The Goliath Challenge
So, Google has a patent in place in regard to brand weighting and how it is calculated. However, it’s pretty difficult to understand.
‘The system determines a site quality score for the particular site, and might be determined by computing a ratio of a numerator and a denominator, where the numerator is based on the count of unique queries that are categorized as ones that refer to the particular site, and where the denominator is based on the count of unique queries that are just associated with the particular site, just don’t refer to it in the same kind of way.’
Perhaps something easier to digest is this piece by Tom Capper over on Moz, around a ranking correlations study which compares domain authority against branded search volume. Basically, bigger brands seem to rank better and have an uplift due to their authority in the market which is certainly a challenge in the travel industry with giants such as Virgin, Thomas Cook and Thomson.
Now I could list at least 20 brands here, but for the purpose of this example I have selected a few that have appeared in a particular SERP that I’m going to be talking about later, with a mixture of big brands, specialists and aggregators.
The scale of this can be seen from a simple bit of keyword research along with monthly volumes:
- Thomas Cook: 1,400,000
- Thomson: 992,000
- Virgin Holidays: 224,000
- Travel Supermarket: 139,000
- Lastminute: 75,000
- Kuoni: 43,000
Market Landscape
I’m sure you all know how to see where you are in comparison to your competitors, with tools such as Sistrix, SEMrush and Searchmetrics allowing you to see your visibility vs. competitors. We prefer to export all of the keywords that each of the brand ranks for, and then categorise, strip out branded terms and then drop it into a graph to give you a visual.
So, for this example we’ve taken a sample set of just over 3,000 keywords, which would equate to just over half a million visits if you were fortunate enough to rank first for them all with conservative CTR assumption.
We then pulled just a few of the brands with visibility for these terms, and below you can see the output:

To summarise this, the higher you are the better your average rank across these terms, and the further to the right means the site ranks for a higher number of terms.
However, looking at a whole market is perhaps a bit too broad, especially with so many locations and resorts, so if you’ve categorised your keywords well you’ll also be able to run graphs for individual categories. Below is an example for Thailand which contains 480 keywords, which again would equate to 69,000 visits, so still a significant amount of traffic:

We can see that Virgin is out in front with a brand presence of more than five times that of the smallest in the list, Kuoni. So how does Kuoni start to compete or even take market share away from all the other brands with pretty much double the awareness?
Let’s take a look…
Links
Like everyone else with any SEO knowledge, I know that it’s not just about number of links. However they are still a very important ranking signal.
Below I’ve simply the taken number of referring domains and domain trust from Majestic and charted this in… you’ve got it, another graph:
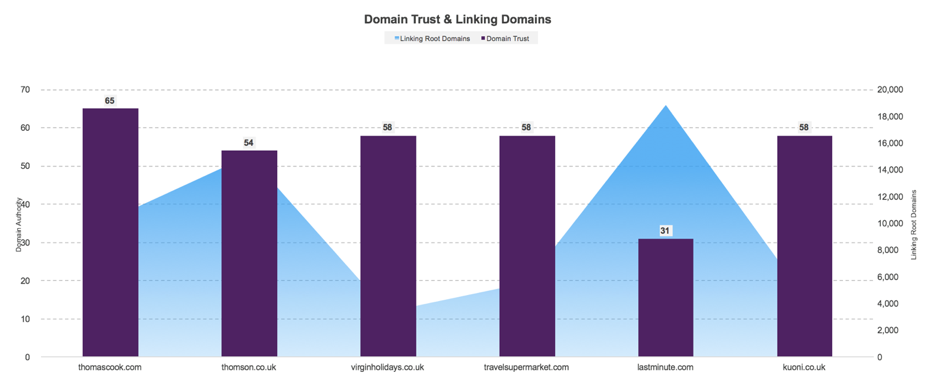
When you correlate the size of brand vs. the volume and quality of links then it’s not representative at all, with Kuoni appearing to do well at earning links and having a higher volume at the same quality as Virgin Holidays. This starts to show that if we took the brand weighting out and relied on authority and links, the market landscape would certainly look different.
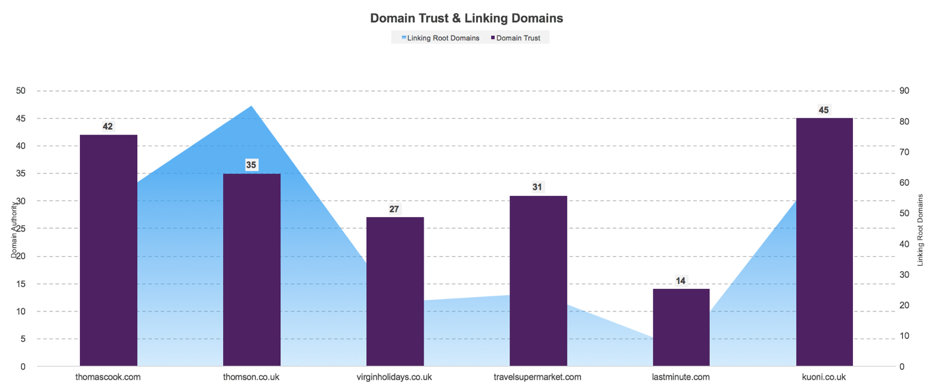
Next, I’ve looked at links into the key destination landing pages. Interestingly this is a slightly different picture: Virgin Holidays only has nine referring domains and a lower quality of links into its Thailand holiday page and Kuoni has three times the volume of links and significantly more domain trust from those domains.
So more links into the whole domain, individual location directories and a better quality from the smaller brand which is competing against these giants:
Engagement
After looking at links I wanted to understand engagement metrics, and for this I used time on site and bounce rate taken from Alexa. 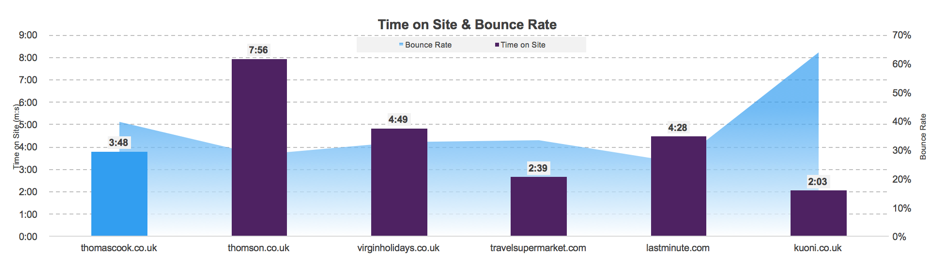
Here’s where some of the bigger brands start to excel and should really be a focus for Kuoni. Interestingly, as they are very bespoke holidays, it links off to a subdomain page potentially making bounce rate inflate and time on site decrease, so would benefit from being all on the same subdomain.
Pages indexed
Next I wanted to understand content depth for pages indexed relevant to Thailand on each of the sites.
Here’s how it stacks up (to get the volume simply type site:{url here} inurl:{location}
- Thomas Cook: 18
- Thomson: 579
- Virgin: 136
- Travel Supermarket: 49
- Last Minute: 4,440
- Kuoni: 349
**slight caveat alert: lastminute.com has the most amount of pages indexed for /Thailand/ simply due to its broad hotel offering.
As we saw earlier Kuoni is significantly smaller in terms of overall branded search volume. However, it has the second highest volume of pages ranking for the Thailand keyword set. This shows the brand is making content work hard in order to drive visibility into the keyword set that’s been sampled, and I’m sure if we were to broaden the number of terms then Kuoni would in fact rank for more terms than a lot of the larger brands.
A good example to look at is perhaps its multi-centre holidays. This has a reasonable monthly search volume of 590 searches per month. For this term, it outperforms the competitors looked at in this post, and when you look at the pages in comparison to each other you can see why…
- http://www.kuoni.co.uk/thailand/multi-centres
- https://www.virginholidays.co.uk/destinations/asia-and-far-east/thailand/multi-destination
- http://www.thomson.co.uk/holidays/multi-centre
- https://www.travelsupermarket.com/en-gb/holidays/thailand/pattaya/
- https://www.thomascook.com/holidays/signature/multi-centre/
Not only has Kuoni written more content on the main landing page, it has also created lots of other landing pages surrounding this term for each location (Koh Samui/Chiang Mai/Bangkok etc) + multi centre and along with an internal linking strategy to this content.
Summary…
If you are running the digital strategy for a large brand then you have the ability of exploiting the power of the patent that’s in place for brand weighting in your favour, but don’t rest on your laurels of simply having “the brand” as being enough.
As we have seen, despite this patent, smaller brands still have a huge opportunity to capture traffic through building and creating relevant landing pages and driving authority into deeper pages of the site.
Below I’ve summarised the findings in a simple table. As we have seen Kuoni is managing to compete with the ‘giants’ of the industry when it comes to visibility of specific locations. While we can see that it is only really competing in the ‘site specifics’ on overall domain authority, Kuoni is focusing on driving deeper authority and creating more location specific content on the site to drive location specific visibility.

Despite this relatively small sample keyword set and list of brands analysed, it’s clear to me that between them they all could be driving further awareness visibility through content output. While a lot of them are ranking for ‘I want to know’ micro-moments they are all appearing much further down the SERP for these types of terms.
For example, ‘things to do in Phuket’ delivers an average of 3,600 searches per month giving the Davids of this world an opportunity to capture lots of this traffic, right at the top of the purchase funnel.
For more on this topic, check out these Econsultancy resources:
SEO David vs. Goliath: How travel sector minnows can overcome their big brand competitors
Perhaps the reason it intrigues me so much is the huge opportunity to grab traffic from the typical head terms, right through to capturing the long tail search queries at the awareness stage in the buying journey. Alongside this is the challenge smaller brands face competing with the giants in the market and having to get smart with leveraging search.
During this post, I want to take you through an example overview of part of the travel market and give an understanding on how smaller brands are capturing search traffic against the bigger brands in the industry.
The Goliath Challenge
So, Google has a patent in place in regard to brand weighting and how it is calculated. However, it’s pretty difficult to understand.
‘The system determines a site quality score for the particular site, and might be determined by computing a ratio of a numerator and a denominator, where the numerator is based on the count of unique queries that are categorized as ones that refer to the particular site, and where the denominator is based on the count of unique queries that are just associated with the particular site, just don’t refer to it in the same kind of way.’
Perhaps something easier to digest is this piece by Tom Capper over on Moz, around a ranking correlations study which compares domain authority against branded search volume. Basically, bigger brands seem to rank better and have an uplift due to their authority in the market which is certainly a challenge in the travel industry with giants such as Virgin, Thomas Cook and Thomson.
Now I could list at least 20 brands here, but for the purpose of this example I have selected a few that have appeared in a particular SERP that I’m going to be talking about later, with a mixture of big brands, specialists and aggregators.
The scale of this can be seen from a simple bit of keyword research along with monthly volumes:
- Thomas Cook: 1,400,000
- Thomson: 992,000
- Virgin Holidays: 224,000
- Travel Supermarket: 139,000
- Lastminute: 75,000
- Kuoni: 43,000
Market Landscape
I’m sure you all know how to see where you are in comparison to your competitors, with tools such as Sistrix, SEMrush and Searchmetrics allowing you to see your visibility vs. competitors. We prefer to export all of the keywords that each of the brand ranks for, and then categorise, strip out branded terms and then drop it into a graph to give you a visual.
So, for this example we’ve taken a sample set of just over 3,000 keywords, which would equate to just over half a million visits if you were fortunate enough to rank first for them all with conservative CTR assumption.
We then pulled just a few of the brands with visibility for these terms, and below you can see the output:
To summarise this, the higher you are the better your average rank across these terms, and the further to the right means the site ranks for a higher number of terms.
However, looking at a whole market is perhaps a bit too broad, especially with so many locations and resorts, so if you’ve categorised your keywords well you’ll also be able to run graphs for individual categories. Below is an example for Thailand which contains 480 keywords, which again would equate to 69,000 visits, so still a significant amount of traffic:
We can see that Virgin is out in front with a brand presence of more than five times that of the smallest in the list, Kuoni. So how does Kuoni start to compete or even take market share away from all the other brands with pretty much double the awareness?
Let’s take a look…
Links
Like everyone else with any SEO knowledge, I know that it’s not just about number of links. However they are still a very important ranking signal.
Below I’ve simply the taken number of referring domains and domain trust from Majestic and charted this in… you’ve got it, another graph:
When you correlate the size of brand vs. the volume and quality of links then it’s not representative at all, with Kuoni appearing to do well at earning links and having a higher volume at the same quality as Virgin Holidays. This starts to show that if we took the brand weighting out and relied on authority and links, the market landscape would certainly look different.
Next, I’ve looked at links into the key destination landing pages. Interestingly this is a slightly different picture: Virgin Holidays only has nine referring domains and a lower quality of links into its Thailand holiday page and Kuoni has three times the volume of links and significantly more domain trust from those domains.
So more links into the whole domain, individual location directories and a better quality from the smaller brand which is competing against these giants:
Engagement
After looking at links I wanted to understand engagement metrics, and for this I used time on site and bounce rate taken from Alexa.
Here’s where some of the bigger brands start to excel and should really be a focus for Kuoni. Interestingly, as they are very bespoke holidays, it links off to a subdomain page potentially making bounce rate inflate and time on site decrease, so would benefit from being all on the same subdomain.
Pages indexed
Next I wanted to understand content depth for pages indexed relevant to Thailand on each of the sites.
Here’s how it stacks up (to get the volume simply type site:{url here} inurl:{location}
- Thomas Cook: 18
- Thomson: 579
- Virgin: 136
- Travel Supermarket: 49
- Last Minute: 4,440
- Kuoni: 349
**slight caveat alert: lastminute.com has the most amount of pages indexed for /Thailand/ simply due to its broad hotel offering.
As we saw earlier Kuoni is significantly smaller in terms of overall branded search volume. However, it has the second highest volume of pages ranking for the Thailand keyword set. This shows the brand is making content work hard in order to drive visibility into the keyword set that’s been sampled, and I’m sure if we were to broaden the number of terms then Kuoni would in fact rank for more terms than a lot of the larger brands.
A good example to look at is perhaps its multi-centre holidays. This has a reasonable monthly search volume of 590 searches per month. For this term, it outperforms the competitors looked at in this post, and when you look at the pages in comparison to each other you can see why…
- http://www.kuoni.co.uk/thailand/multi-centres
- https://www.virginholidays.co.uk/destinations/asia-and-far-east/thailand/multi-destination
- http://www.thomson.co.uk/holidays/multi-centre
- https://www.travelsupermarket.com/en-gb/holidays/thailand/pattaya/
- https://www.thomascook.com/holidays/signature/multi-centre/
Not only has Kuoni written more content on the main landing page, it has also created lots of other landing pages surrounding this term for each location (Koh Samui/Chiang Mai/Bangkok etc) + multi centre and along with an internal linking strategy to this content.
Summary…
If you are running the digital strategy for a large brand then you have the ability of exploiting the power of the patent that’s in place for brand weighting in your favour, but don’t rest on your laurels of simply having “the brand” as being enough.
As we have seen, despite this patent, smaller brands still have a huge opportunity to capture traffic through building and creating relevant landing pages and driving authority into deeper pages of the site.
Below I’ve summarised the findings in a simple table. As we have seen Kuoni is managing to compete with the ‘giants’ of the industry when it comes to visibility of specific locations. While we can see that it is only really competing in the ‘site specifics’ on overall domain authority, Kuoni is focusing on driving deeper authority and creating more location specific content on the site to drive location specific visibility.
Despite this relatively small sample keyword set and list of brands analysed, it’s clear to me that between them they all could be driving further awareness visibility through content output. While a lot of them are ranking for ‘I want to know’ micro-moments they are all appearing much further down the SERP for these types of terms.
For example, ‘things to do in Phuket’ delivers an average of 3,600 searches per month giving the Davids of this world an opportunity to capture lots of this traffic, right at the top of the purchase funnel.
For more on this topic, check out these Econsultancy resources:
SEO David vs. Goliath: How travel sector minnows can overcome their big brand competitors
Perhaps the reason it intrigues me so much is the huge opportunity to grab traffic from the typical head terms, right through to capturing the long tail search queries at the awareness stage in the buying journey. Alongside this is the challenge smaller brands face competing with the giants in the market and having to get smart with leveraging search.
During this post, I want to take you through an example overview of part of the travel market and give an understanding on how smaller brands are capturing search traffic against the bigger brands in the industry.
The Goliath Challenge
So, Google has a patent in place in regard to brand weighting and how it is calculated. However, it’s pretty difficult to understand.
‘The system determines a site quality score for the particular site, and might be determined by computing a ratio of a numerator and a denominator, where the numerator is based on the count of unique queries that are categorized as ones that refer to the particular site, and where the denominator is based on the count of unique queries that are just associated with the particular site, just don’t refer to it in the same kind of way.’
Perhaps something easier to digest is this piece by Tom Capper over on Moz, around a ranking correlations study which compares domain authority against branded search volume. Basically, bigger brands seem to rank better and have an uplift due to their authority in the market which is certainly a challenge in the travel industry with giants such as Virgin, Thomas Cook and Thomson.
Now I could list at least 20 brands here, but for the purpose of this example I have selected a few that have appeared in a particular SERP that I’m going to be talking about later, with a mixture of big brands, specialists and aggregators.
The scale of this can be seen from a simple bit of keyword research along with monthly volumes:
- Thomas Cook: 1,400,000
- Thomson: 992,000
- Virgin Holidays: 224,000
- Travel Supermarket: 139,000
- Lastminute: 75,000
- Kuoni: 43,000
Market Landscape
I’m sure you all know how to see where you are in comparison to your competitors, with tools such as Sistrix, SEMrush and Searchmetrics allowing you to see your visibility vs. competitors. We prefer to export all of the keywords that each of the brand ranks for, and then categorise, strip out branded terms and then drop it into a graph to give you a visual.
So, for this example we’ve taken a sample set of just over 3,000 keywords, which would equate to just over half a million visits if you were fortunate enough to rank first for them all with conservative CTR assumption.
We then pulled just a few of the brands with visibility for these terms, and below you can see the output:
To summarise this, the higher you are the better your average rank across these terms, and the further to the right means the site ranks for a higher number of terms.
However, looking at a whole market is perhaps a bit too broad, especially with so many locations and resorts, so if you’ve categorised your keywords well you’ll also be able to run graphs for individual categories. Below is an example for Thailand which contains 480 keywords, which again would equate to 69,000 visits, so still a significant amount of traffic:
We can see that Virgin is out in front with a brand presence of more than five times that of the smallest in the list, Kuoni. So how does Kuoni start to compete or even take market share away from all the other brands with pretty much double the awareness?
Let’s take a look…
Links
Like everyone else with any SEO knowledge, I know that it’s not just about number of links. However they are still a very important ranking signal.
Below I’ve simply the taken number of referring domains and domain trust from Majestic and charted this in… you’ve got it, another graph:
When you correlate the size of brand vs. the volume and quality of links then it’s not representative at all, with Kuoni appearing to do well at earning links and having a higher volume at the same quality as Virgin Holidays. This starts to show that if we took the brand weighting out and relied on authority and links, the market landscape would certainly look different.
Next, I’ve looked at links into the key destination landing pages. Interestingly this is a slightly different picture: Virgin Holidays only has nine referring domains and a lower quality of links into its Thailand holiday page and Kuoni has three times the volume of links and significantly more domain trust from those domains.
So more links into the whole domain, individual location directories and a better quality from the smaller brand which is competing against these giants:
Engagement
After looking at links I wanted to understand engagement metrics, and for this I used time on site and bounce rate taken from Alexa.
Here’s where some of the bigger brands start to excel and should really be a focus for Kuoni. Interestingly, as they are very bespoke holidays, it links off to a subdomain page potentially making bounce rate inflate and time on site decrease, so would benefit from being all on the same subdomain.
Pages indexed
Next I wanted to understand content depth for pages indexed relevant to Thailand on each of the sites.
Here’s how it stacks up (to get the volume simply type site:{url here} inurl:{location}
- Thomas Cook: 18
- Thomson: 579
- Virgin: 136
- Travel Supermarket: 49
- Last Minute: 4,440
- Kuoni: 349
**slight caveat alert: lastminute.com has the most amount of pages indexed for /Thailand/ simply due to its broad hotel offering.
As we saw earlier Kuoni is significantly smaller in terms of overall branded search volume. However, it has the second highest volume of pages ranking for the Thailand keyword set. This shows the brand is making content work hard in order to drive visibility into the keyword set that’s been sampled, and I’m sure if we were to broaden the number of terms then Kuoni would in fact rank for more terms than a lot of the larger brands.
A good example to look at is perhaps its multi-centre holidays. This has a reasonable monthly search volume of 590 searches per month. For this term, it outperforms the competitors looked at in this post, and when you look at the pages in comparison to each other you can see why…
- http://www.kuoni.co.uk/thailand/multi-centres
- https://www.virginholidays.co.uk/destinations/asia-and-far-east/thailand/multi-destination
- http://www.thomson.co.uk/holidays/multi-centre
- https://www.travelsupermarket.com/en-gb/holidays/thailand/pattaya/
- https://www.thomascook.com/holidays/signature/multi-centre/
Not only has Kuoni written more content on the main landing page, it has also created lots of other landing pages surrounding this term for each location (Koh Samui/Chiang Mai/Bangkok etc) + multi centre and along with an internal linking strategy to this content.
Summary…
If you are running the digital strategy for a large brand then you have the ability of exploiting the power of the patent that’s in place for brand weighting in your favour, but don’t rest on your laurels of simply having “the brand” as being enough.
As we have seen, despite this patent, smaller brands still have a huge opportunity to capture traffic through building and creating relevant landing pages and driving authority into deeper pages of the site.
Below I’ve summarised the findings in a simple table. As we have seen Kuoni is managing to compete with the ‘giants’ of the industry when it comes to visibility of specific locations. While we can see that it is only really competing in the ‘site specifics’ on overall domain authority, Kuoni is focusing on driving deeper authority and creating more location specific content on the site to drive location specific visibility.
Despite this relatively small sample keyword set and list of brands analysed, it’s clear to me that between them they all could be driving further awareness visibility through content output. While a lot of them are ranking for ‘I want to know’ micro-moments they are all appearing much further down the SERP for these types of terms.
For example, ‘things to do in Phuket’ delivers an average of 3,600 searches per month giving the Davids of this world an opportunity to capture lots of this traffic, right at the top of the purchase funnel.
For more on this topic, check out these Econsultancy resources:
How to Diagnose Pages that Rank in One Geography But Not Another – Whiteboard Friday
Posted by randfish
Are you ranking pretty well in one locale, only to find out your rankings tank in another? It’s not uncommon, even for sites without an intent to capture local queries. In today’s Whiteboard Friday, Rand shows you how to diagnose the issue with a few clever SEO tricks, then identify the right strategy to get back on top.

Click on the whiteboard image above to open a high-resolution version in a new tab!
Video Transcription
Howdy, Moz fans, and welcome to this edition of Whiteboard Friday. This week we’re going to chat about rankings that differ from geography to geography. Many of you might see that you are ranking particularly well in one city, but when you perform that search in another city or in another country perhaps, that still speaks the same language and has very similar traits, that maybe you’re not performing well.
Maybe you do well in Canada, but you don’t do well in the United States. Maybe you do well in Portland, Oregon, but you do poorly in San Diego, California. Sometimes you might be thinking to yourself, “Well, wait, this search is not particularly local, or at least I didn’t think of it as being particularly local. Why am I ranking in one and not the other?” So here’s a process that you can use to diagnose.

Confirm the rankings you see are accurate:
The first thing we need to do is confirm that the rankings you see or that you’ve heard about are accurate. This is actually much more difficult than it used to be. It used to be you could scroll to the bottom of Google and change your location to whatever you wanted. Now Google will geolocate you by your IP address or by a precise location on your mobile device, and unfortunately you can’t just specify one particular location or another — unless you know some of these SEO hacks.
A. Google’s AdPreview Tool – Google has an ad preview tool, where you can specify and set a particular location. That’s at AdWords.Google.com slash a bunch of junk slash ad preview. We’ll make sure that the link is down in the notes below.
B. The ampersand-near-equals parameter (&near=) – Now, some SEOs have said that this is not perfect, and I agree it is imperfect, but it is pretty close. We’ve done some comparisons here at Moz. I’ve done them while I’m traveling. It’s not bad. Occasionally, you’ll see one or two things that are not the same. The advertisements are frequently not the same. In fact, they don’t seem to work well. But the organic results look pretty darn close. The maps results look pretty darn close. So I think it’s a reasonable tool that you can use.
That is by basically changing the Google search query — so this is the URL in the search query — from Google.com/search?q= and then you might have ice+cream or WordPress+web+design, and then you use this, &near= and the city and state here in the United States or city and province in Canada or city and region in another country. In this case, I’m going with Portland+OR. This will change my results. You can give this a try yourself. You can see that you will see the ice cream places that are in Portland, Oregon, when you perform this search query.
For countries, you can use another one. You can either go directly to the country code Google, so for the UK Google.co.uk, or for New Zealand Google.co.nz, or for Canada Google.ca. Then you can type that in.You can also use this parameter &GL= instead of &near. This is global location equals the country code, and then you could put in CA for Canada or UK for the UK or NZ for New Zealand.
C. The Mozbar’s search profiles – You can also do this with the MozBar. The MozBar kind of hacks the near parameter for you, and you can just specify a location and create a search profile. Do that right inside the MozBar. That’s one of the very nice things about using it.
D. Rank tracking with a platform that supports location-specific rankings – Some of them don’t, some of them do. Moz does right now. I believe Searchmetrics does if you use the enterprise. Oh, I’m trying to remember if Rob Bucci said STAT does. Well, Rob will answer in the comments, and he’ll tell us whether STAT does. I think that they do.

Look at who IS ranking and what features they may have:
So next, once you’ve figured out whether this ranking anomaly that you perceive is real or not, you can step two look at who is ranking in the one where you’re not and figure out what factors they might have going for them.
- Have they gotten a lot of local links, location-specific links from these websites that are in that specific geography or serve that geography, local chambers of commerce, local directories, those kinds of things?
- Do they have a more hyper-local service area? On a map, if this is the city, do they serve that specific region? You serve a broad set of locations all over the place, and maybe you don’t have a geo-specific region that you’re serving.
- Do they have localized listings, listings in places like where Moz Local or a competitor like Yext or Whitespark might push all their data to? Those could be things like Google Maps and Bing Maps, directories, local data aggregators, Yelp, TripAdvisor, etc., etc.
- Do they have rankings in Google Maps? If you go and look and you see that this website is ranking particularly well in Google Maps for that particular region and you are not, that might be another signal that hyper-local intent and hyper-local ranking signals, ranking algorithm is in play there.
- Are they running local AdWords ads? I know this might seem like, “Wait a minute. Rand, I thought ads were not directly connected to organic search results.” They’re not, but it tends to be the case that if you bid on AdWords, you tend to increase your organic click-through rate as well, because people see your ad up at the top, and then they see you again a second time, and so they’re a little more biased to click. Therefore, buying local ads can sometimes increase organic click-through rate as well. It can also brand people with your particular business. So that is one thing that might make a difference here.

Consider location-based searcher behaviors:
Now we’re not considering who is ranking, but we’re considering who is doing the searching, these location-based searchers and what their behavior is like.
- Are they less likely to search for your brand because you’re not as well known in that region?
- Are they less likely to click your site in the SERPs because you’re not as well known?
- Is their intent somehow different because of their geography? Maybe there’s a language issue or a regionalism of some kind. This could be a local language thing even here in the United States, where parts of the country say “soda” and parts of the country say “pop.” Maybe those mean two different things, and “pop” means, “Oh, it’s a popcorn store in Seattle,” because there’s the Pop brand, but in the Midwest, “pop” clearly refers to types of soda beverages.
- Are they more or less sensitive to a co-located solution? So it could be that in many geographies, a lot of your market doesn’t care about whether the solution that they’re getting is from their local region, and in others it does. A classic one on a country level is France, whose searchers tend to care tremendously more that they are getting .fr results and that the location of the business they are clicking on is in France versus other folks in Europe who might click a .com or a .co.uk with no problem.

Divide into three buckets:
You’re going to divide the search queries that you care about that have these challenges into three different types of buckets:
Bucket one: Hyper-geo-sensitive
This would be sort of the classic geo-specific search, where you see maps results right up at the top. The SERPs change completely from geo to geo. So if you perform the search in Portland and then you perform it in San Diego, you see very, very different results. Seven to nine of the top ten at least are changing up, and it’s the case that almost no non-local listings are showing in the top five results. When you see these, this is probably non-targetable without a physical location in that geography. So if you don’t have a physical location, you’re kind of out of business until you get there. If you do, then you can work on the local ranking signals that might be holding you back.
Bucket two: Semi-geo-sensitive
I’ve actually illustrated this one over here, because this can be a little bit challenging to describe. But basically, you’re getting a mix of geo-specific and global results. So, for example, I use the &near=Portland, Oregon, because I’m in Seattle and I want to see Portland’s results for WordPress web design.

WordPress web design, when I do the search all over the United States, the first one or two results are pretty much always the same. They’re always this Web Savvy Marketing link and this Creative Bloq, and they’re very broad. They are not specifically about a local provider of WordPress web design.
But then you get to number three and four and five, and the results change to be local-specific businesses. So in Portland, it’s these Mozak Design guys. Mozak, no relation to Moz, to my knowledge anyway. In San Diego, it’s Kristin Falkner, who’s ranking number three, and then other local San Diego WordPress web design businesses at four and five. So it’s kind of this mix of geo and non-geo. You can generally tell this by looking and changing your geography in this fashion seeing those different things.
Some of the top search results usually will be like this, and they’ll stay consistent from geography to geography. In these cases, what you want to do is work on boosting those local-specific signals. So if you are ranking number five or six and you want to be number three, go for that, or you can try and be in the global results, in which case you’re trying to boost the classic ranking signals, not the local ones so you can get up there.
Bucket three: Non-geo-sensitive
Those would be, “I do this search, and I don’t see any local-specific results.” It’s just a bunch of nationwide or worldwide brands. There are no maps, usually only one, maybe two geo-specific results in the top 10, and they tend to be further down, and the SERPs barely change from geo to geo. They’re pretty much the same throughout the country.
So once you put these into these three buckets, then you know which thing to do. Here, it’s pursue classic signals. You probably don’t need much of a local boost.
Here, you have the option of going one way or the other, boosting local signals to get into these rankings or boosting the classic signals to get into those global ones.
Here you’re going to need the physical business.
All right, everyone. I hope you’ve enjoyed this edition of Whiteboard Friday, and we’ll see you again next week. Take care.
Video transcription by Speechpad.com
Sign up for The Moz Top 10, a semimonthly mailer updating you on the top ten hottest pieces of SEO news, tips, and rad links uncovered by the Moz team. Think of it as your exclusive digest of stuff you don’t have time to hunt down but want to read!
SearchCap: Google local pack mentions, Google Shopping reports & PPC evals
Below is what happened in search today, as reported on and from other places across the web.
The post SearchCap: Google local pack mentions, Google Shopping reports & PPC evals appeared first on Search Engine Land.
Please visit Search Engine Land for the full article.
Google Shopping gets top spot impression share & product diagnostics reporting
The updates are available in the new AdWords interface.
The post Google Shopping gets top spot impression share & product diagnostics reporting appeared first on Search Engine Land.
Please visit Search Engine Land for the full article.
[Report] Who owns the flights market in search?
A new report by Pi Datametrics has analyzed the entire US flights market to discover the most organically valuable search themes and players with the greatest share of voice across the market. What can marketers learn from it about the state of the flights market in search?
Evaluating PPC talent, part 2: The test
In part 2 of his series on evaluating PPC candidates, columnist Brett Middleton shares some tests you can administer to determine whether a potential hire is a good fit for your business.
The post Evaluating PPC talent, part 2: The test appeared first…
Why microsites aren’t always ideal for SEO
Microsites have their uses, but columnist Janet Driscoll Miller argues that they can often create unnecessary headaches for search engine optimization professionals.
The post Why microsites aren’t always ideal for SEO appeared first on Search Engine Land.
Please visit Search Engine Land for the full article.
Google My Business fixes week-long reporting bug with photo insights
Google has finally fixed the Google Insights reports in Google My Business.
The post Google My Business fixes week-long reporting bug with photo insights appeared first on Search Engine Land.
Please visit Search Engine Land for the full article.
Google Analytics: Misunderstandings that hold marketers back
As Google continues to improve its analytics offerings, marketers need to understand the data in front of them. Unfortunately, there are a few misunderstandings surrounding the way that Google collects, configures, processes, and reports data. Here are some commonly misunderstood metrics and features within the core Google Analytics interface.
Google AdSense User First Program
Some publishers over at WebmasterWorld and Google AdSense Help forums are saying they are now seeing an invitation within their Google AdSense interface to join the User First beta program…
Google AdWords Report Editor Adds Cross-Account Reporting
Now in the Google AdWords Report Editor you can do cross-account reporting to see all your important metrics across your manager account in one single report. Google quietly announced this new feature on both Google+ and Twitter…
Google AdWords Tests More Sitelinks Dropdown Button
Tauqeer Aziz shared a screen shot with me on Twitter of Google AdWords testing a sitelinks layout that has a “more” link that drops down to show additional sitelinks in the overlay…
Google: We’ve Changed The Way We Think About The Panda Algorithm
Gary Illyes from Google said on Twitter this morning that Google has changed the way they think about Panda from five years ago. Gary wrote “we’ve changed the way we think about Panda.” He added, “what was true 5 or so years ago…
Google Local Pack Shows Query From Website Content Of Local Listing
Here is a new local pack test where Google is showing when the query matches content on the local businesses website.
Ranking your local business part 6: The impact of reviews
This is the sixth post in an 8-part series on how to rank your business for local searches at Google. Previously, I’ve listed the most important aspects that influence your local ranking, discussed how to get the most out of Google My Business, covered best practices for on-site optimization. I’ve also given you some ideas […]
The post Ranking your local business part 6: The impact of reviews appeared first on Yoast.