Understanding Cross-Device Attribution And Adjusting Campaigns Accordingly
Columnist Mona Elesseily explains why multi-device attribution is important and explores solutions for finding credible data on customers using two or three digital devices.
The post Understanding Cross-Device Attribution And Adjusting Campaigns Accor…
Writing a blog: creating a clear blog post structure
A few weeks ago, I wrote a post about obtaining an attractive writing style. I gave some practical tips to make your blogs more readable. In this post, I will give practical tips to help you set up a nice and clear blog structure. Before the end of this year, I will write a final…
This post first appeared on Yoast. Whoopity Doo!
Google Speeds Up Mobile Search By 100-150 Milliseconds
Google’s speed guru, Ilya Grigorik, announced on Google+ that they’ve made Google mobile search a bit faster…
Google Lightbox Ads Now Work On Mobile
Google announced they have enabled their lightbox ads to work across all screen sizes, from desktop, to tablet, to mobile phones.
The new Lightbox ads are now available for all AdWords advertisers globally and work across all devices…
Google App Indexing: 15% Of Android Searches Return Deep Links
Google posted on several blogs yesterday an update on app indexing which includes how tos and some stats.
Here are two interesting stats:
(1) For signed-in users, 15% of Google searches on Android now return deep links to apps through App Indexing……
Google Mobile Friendly Label Goes International
It looks like Google is now rolling out the mobile friendly labels globally and in all languages…
The Dynamics Of The Search Ad Marketplace: Dissecting A Moving Target
Columnist John Cosley of Microsoft shares insights about how Cost Per Click, Ad Click-Through Rate, and search volume organically evolve throughout the day.
The post The Dynamics Of The Search Ad Marketplace: Dissecting A Moving Target appeared first …
Why a Mobile-Friendly Website Is Essential to a Successful SEO Strategy in 2015
Some organizations are still resistant to having a mobile-friendly website, either because they lack the resources or don’t see the value. If you would like to continue being relevant in 2015 on Google, then now is the time to begin building a mobile-friendly website.
Google Says Penguin To Shift To “Continuous Updates”
Google To Continuously “Optimize” The Penguin Algorithm As It Goes
The post Google Says Penguin To Shift To “Continuous Updates” appeared first on Search Engine Land.
Please visit Search Engine Land for the full article.
Examining Search and Social Behavior for Holiday Shopping
Here’s a look at some search and social trends that occurred over the past few weeks, with a focus on Black Friday and Cyber Monday.
Google AdWords Adds Custom Columns
Google announced on Google+ that they’ve enabled a way for advertisers to customize the columns they want to see in their reports.
Google said they are “introducing custom columns to AdWords reporting…
Avoiding Content Marketing Spam: Content & SEO Culture, Process, Ownership
Before you map your 2015 content and SEO strategy, understand the different types of content that your organization needs, and have processes in place for authoring and production of different types of content. …
How to Prevent Client Failures in SEO Public Relations
Taking the time to prepare your SEO client to effectively speak to the media can help you successfully move out of any SEO silo.
eek a new kind of negative SEO tactic By sending negative CTR signals
In this great post by Bartosz Góralewicz, he lays out how using a bot to search google and not click on the target website can send negative CTR signals to the site…especially in light of all the
Wait…What? “56 pct of All Ad Impressions Are Not Seen”
I was scanning WMW and this stopped me in my tracks: http://www.webmasterworld.com/goog/4720495.htm
read more
Bing Talks Content Quality as Primary Ranking Factor – what can we learn?
Bing talks the role of content quality on their blog This is a pretty detailed and interesting post :
read more
Lessons from the Front Line of Front-End Content Development
Posted by richardbaxterseo
As content marketing evolves, the list of media you could choose to communicate your message expands. So does the list of technologies at your disposal. But without a process, a project plan and a tried and tested approach, you might struggle to gain any traction at all.
In this post, based on my
MozCon 2014 presentation, I’d like to share the high level approach we take while developing content for our clients, and the lessons we’ve learned from initial research to final delivery. Hopefully there are some takeaways for you to enhance your own approach or make your first project a little less difficult.
This stuff is hard to do
I hate to break it to you, but the first few times you attempt to develop something
a little more innovative, you’re going to get burned. Making things is pretty tough and there are lots of lessons to learn. Sometimes you’ll think your work is going to be huge, and it flops. That sucks, move on, learn and maybe come back later to revisit your approach.
To structure and execute a genuinely innovative, successful content marketing campaign, you need to understand what’s possible, especially within the context of your available skills, process, budget, available time and scope.
You’ll have a few failures along the journey, but when something goes viral, when people respond positively to your work – that, friends, feels amazing.
What this post is designed to address
In the early days of SEO, we built links. Email outreach, guest posting, eventually, infographics. It was easy, for a time. Then,
Penguin came and changed everything.
Our industry learned that we should be finding creative and inventive ways to solve our customers’ problems, inspire, guide, help – whatever the solution, an outcome had to be justified. Yet still, a classic habit of the SEO remained: the need to decide in what form the content should be executed before deciding on the message to tell.
I think we’ve evolved from “let’s do an infographic on something!” to “I’ve got a concept that people will love – should this be long form, an interactive, a data visualization, an infographic, a video, or something else?”
This post is designed to outline the foundations on an approach you can use to enhance your approach to content development. If you take one thing away from this article, let it be this:
The first rule of almost anything: be prepared or prepare to fail. This rule definitely applies to content development!
Understand the technical environment you’re hosting your content in
Never make assumptions about the technical environment your content will be hosted in. We’ve learned to ask more about technical setup of a client’s website. You see, big enterprise class sites usually have load balancing,
pre-rendering, and very custom JavaScript that could introduce technical surprises much too late in the process. Better to be aware of what’s in store than hope your work will be compatible with its eventual home.
Before you get started on any development or design, make sure you’ve built an awareness of your client’s development and production environments. Find out more about their CMS, code base, and ask what they can and cannot host.
Knowing more about the client’s development schedule, for example how quickly a project can be uploaded, will help you plan lead times into your project documentation.
We’ve found that discussing early stage ideas with your client’s development team will help them visualise the level of task required to get something live. Involving them at this early stage means you’re informed on any potential risk in technology choice that will harm your project integrity later down the line.
Initial stakeholder outreach and ideation
Way back at MozCon 2013, I presented an idea called “really targeted outreach“. The concept was simple: find influential people in your space, learn more about the people they influence, and build content that appeals to both.
We’ve been using a similar methodology for larger content development projects: using social data to inspire the creative process gathered from the Twitter Firehose and
other freely available tools, reaching out to identified influencers and ask them to contribute or feedback on an idea. The trick is to execute your social research at a critical, early stage of the content development process. Essentially, you’re collecting data to gain a sense of confidence in the appeal of your content.
We’ve made content with such a broad range of people involved, from astronauts to butlers working at well known, historic hotels. With a little of the right approach to outreach, it’s amazing how helpful people can be. Supplemented by the confidence you’ve gained from your data, some positive results from your early stage outreach can really set a content project on the right course.
My tip: outreach and research several ideas and tell your clients which was most popular. If you can get them excited and behind the idea with the biggest response then you’ll find it easier to get everyone on the same page throughout your project.
Asset collection and research
Now, the real work begins. As I’ve
written elsewhere, I believe that the depth of your content, it’s accuracy and integrity is an absolute must if it is to be taken seriously by those it’s intended for.
Each project tends to be approached a little differently, although I tend to see these steps in almost every one: research, asset collection, storyboarding and conceptual illustration.
For asset collection and research, we use a tool called
Mural.ly – a wonderful collaborative tool to help speed up the creative process. Members of the project team begin by collecting relevant information and assets (think: images, quotes, video snippets) and adding them to the project. As the collection evolves, we begin to arrange the data into something that might resemble a timeline:

After a while, the story begins to take shape. Depending on how complex the concept is, we’ll either go ahead with some basic illustration (a “white board session”) or we’ll detail the storyboard in a written form. Here’s the Word document that summarised the chronological order of the content we’d planned for our
Messages in the Deep project:

And, if the brief is more complex, we’ll create a more visual outline in a whiteboard session with our designers:

How do you decide on the level of brief needed to describe your project? Generally, the more complex the project, the more important a full array of briefing materials and project scoping will be. If, however, we’re talking simpler, like “long form” article content, the chances are a written storyboard and a collection of assets should be enough.

Over time, we’ve learned how to roll out content that’s partially template based, rather than having to re-invent the wheel each time. Dan’s amazing
Log File Analysis guide was reused when we decided to re-skin the Schema Guide, and as a result we’ve decided to give Kaitlin’s Google Analytics Guide the same treatment.
Whichever process you choose, it helps to re-engage your original contributors, influencers and publishers for feedback. Remember to keep them involved at key stages – if for no other reason than to make sure you’re meeting their expectations on content they’d be willing to share.
Going into development
Obviously we could talk all day about the development process. I think I’ll save the detail for my next post, but suffice it to say we’ve learned some big things along the way.
Firstly, it’s good to brief your developers well before the design and content is finalised. Particularly if there are features that might need some thought and experimental prototyping. I’ve found over time that a conversation with a developer leads to a better understanding of what’s easily possible with existing libraries and code. If you don’t involve the developers in the design process, you may find yourself committed to building something extremely custom, and your project timeline can become drastically underestimated.
It’s also really important to make sure that your developers have had the opportunity to specify how they’d like the design work to be delivered; file format; layers and sizing for different break points are all really important to an efficient development schedule and make a huge difference to the agility of your work.
Our developers like to have a logical structure of layers and groups in a PSD. Layers and groups should all be named and it’s a good idea to attach different UI states for interactive elements (buttons, links, tabs, etc.), too.
Grid layouts are much preferred although it doesn’t matter if it’s 1200px or 960px, or 12/16/24 columns. As long as the content has some structure, development is easier.
As our developers like to say: Because structure = patterns = abstraction = good things and in an ideal world they prefer to work with
style tiles.
Launching
Big content takes more promotion to get that all important initial traction. Your outreach strategy has already been set, you’ve defined your influencers, and you have buy in from publishers. So, as soon as your work is ready, go ahead and tell your stakeholders it’s live and get that flywheel turning!
My pro tip for a successful launch is be prepared to offer customised content for certain publishers. Simple touches, like
The Washington Post’s animated GIF idea was a real touch of genius – I think some people liked the GIF more than the actual interactive! This post on Mashable was made possible by our development of some of the interactive to be iFramed – publishers seem to love a different approach, so try to design that concept in right at the beginning of your plan. From there, stand back, measure, learn and never give up!
That’s it for today’s post. I hope you’ve found it informative, and I look forward to your comments below.
Sign up for The Moz Top 10, a semimonthly mailer updating you on the top ten hottest pieces of SEO news, tips, and rad links uncovered by the Moz team. Think of it as your exclusive digest of stuff you don’t have time to hunt down but want to read!
SearchCap: Bing Content Quality, Google Maps Evolves & Sofa Sunday
Below is what happened in search today, as reported on Search Engine Land and from other places across the web. From Search Engine Land: To Create Useful Links, Think Like A User, Not A Content Producer Are you letting your users down by focusing too m…
The four steps to appiness
Webmaster Level: intermediate to advanced
App deep links are the new kid on the block in organic search, and they’re picking up speed faster than you can say “schema.org ViewAction”! For signed-in users, 15% of Google searches on Android now return deep links to apps through App Indexing. And over just the past quarter, we’ve seen the number of clicks on app deep links jump by 10x.
We’ve gotten a lot of feedback from developers and seen a lot of implementations gone right and others that were good learning experiences since we opened up App Indexing back in June. We’d like to share with you four key steps to monitor app performance and drive user engagement:
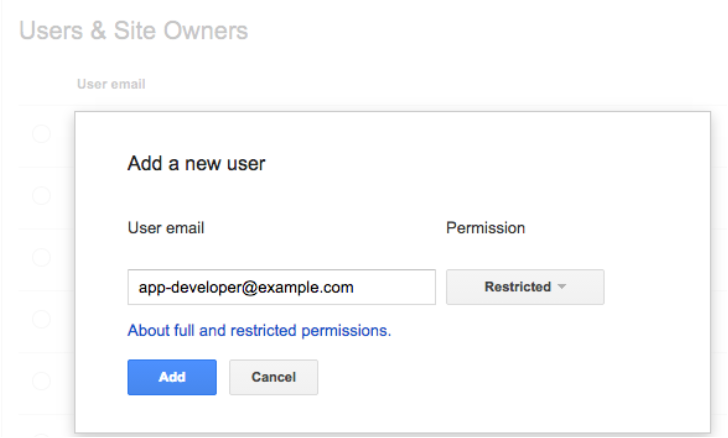
1. Give your app developer access to Webmaster Tools
App indexing is a team effort between you (as a webmaster) and your app development team. We show information in Webmaster Tools that is key for your app developers to do their job well. Here’s what’s available right now:
- Errors in indexed pages within apps
- Weekly clicks and impressions from app deep link via Google search
- Stats on your sitemap (if that’s how you implemented the app deep links)
…and we plan to add a lot more in the coming months!
We’ve noticed that very few developers have access to Webmaster Tools. So if you want your app development team to get all of the information they need to fix app-related issues, it’s essential for them to have access to Webmaster Tools.
Any verified site owner can add a new user. Pick restricted or full permissions, depending on the level of access you’d like to give:
2. Understand how your app is doing in search results
How are users engaging with your app from search results? We’ve introduced two new ways for you to track performance for your app deep links:
- We now send a weekly clicks and impressions update to the Message center in your Webmaster Tools account.
- You can now track how much traffic app deep links drive to your app using referrer information – specifically, the referrer extra in the ACTION_VIEW intent. We’re working to integrate this information with Google Analytics for even easier access. Learn how to track referrer information on our Developer site.
3. Make sure key app resources can be crawled
Blocked resources are one of the top reasons for the “content mismatch” errors you see in Webmaster Tools’ Crawl Errors report. We need access to all the resources necessary to render your app page. This allows us to assess whether your associated web page has the same content as your app page.
To help you find and fix these issues, we now show you the specific resources we can’t access that are critical for rendering your app page. If you see a content mismatch error for your app, look out for the list of blocked resources in “Step 5” of the details dialog:

4. Watch out for Android App errors
To help you identify errors when indexing your app, we’ll send you messages for all app errors we detect, and will also display most of them in the “Android apps” tab of the Crawl errors report.
In addition to the currently available “Content mismatch” and “Intent URI not supported” error alerts, we’re introducing three new error types:
- APK not found: we can’t find the package corresponding to the app.
- No first-click free: the link to your app does not lead directly to the content, but requires login to access.
- Back button violation: after following the link to your app, the back button did not return to search results.
In our experience, the majority of errors are usually caused by a general setting in your app (e.g. a blocked resource, or a region picker that pops up when the user tries to open the app from search). Taking care of that generally resolves it for all involved URIs.
Good luck in the pursuit of appiness! As always, if you have questions, feel free to drop by our Webmaster help forum.
Posted by Mariya Moeva, Webmaster Trends Analyst
