How listening to our users helped us build a better Search Console
The new Search Console beta is up and running. We’ve been flexing our listening muscles and finding new ways to incorporate your feedback into the design. In this new release we’ve initially focused on building features supporting the users’ main goals and we’ll be expanding functionality in the months to come. While some changes have been long expected, like refreshing the UI with Material Design, many changes are a result of continuous work with you, the Search Console users.
We’ve used 3 main communication channels to hear what our users are saying: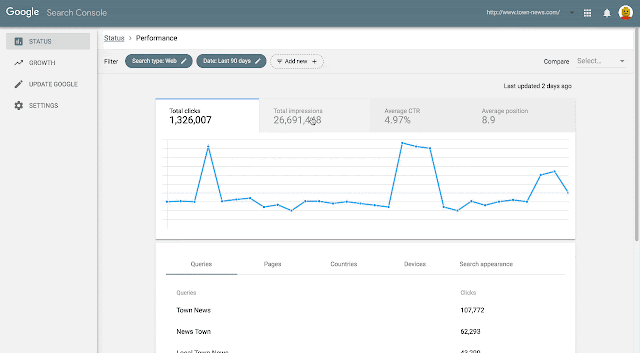
We’ve used 3 main communication channels to hear what our users are saying:
- Help forum Top Contributors – Top Contributors in our help forums have been very helpful in bringing up topics seen in the forums. They communicate regularly with Google’s Search teams, and help the large community of Search Console users.
- Open feedback – We analyzed open feedback comments about classic Search Console and identified the top requests coming in. Open feedback can be sent via the ‘Submit feedback’ button in Search Console. This open feedback helped us get more context around one of the top requests from the last years: more than 90 days of data in the Search Analytics (Performance) report. We learned of the need to compare to a similar period in the previous year, which confirmed that our decision to include 16 months of data might be on the right track.
- Search Console panel – Last year we created a new communication channel by enlisting a group of four hundred randomly selected Search Console users, representing websites of all sizes. The panel members took part in almost every design iteration we had throughout the year, from explorations of new concepts through surveys, interviews and usability tests. The Search Console panel members have been providing valuable feedback which helped us test our assumptions and improve designs.
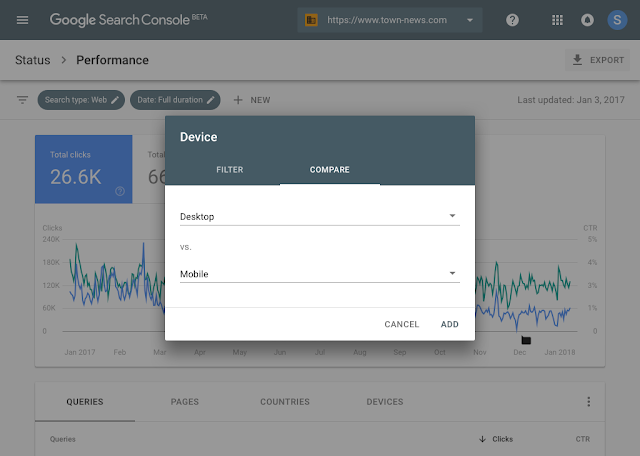
In one of these rounds we tested the new suggested design for the Performance report. Specifically we wanted to see whether it was clear how to use the ‘compare’ and ‘filter’ functionalities. To create an experience that felt as real as possible, we used a high fidelity prototype connected to real data. The prototype allowed study participants to freely interact with the user interface before even one row of production code had been written.

In this study we learned that the ‘compare’ functionality was often overlooked. We consequently changed the design with ‘filter’ and ‘compare’ appearing in a unified dialogue box, triggered when the ‘Add new’ chip is clicked. We continue to test this design and others to optimize its usability and usefulness.

We incorporated user feedback not only in practical design details, but also in architectural decisions. For example, user feedback led us to make major changes in the product’s core information architecture influencing the navigation and product structure of the new Search Console. The error and coverage reports were originally separated which could lead to multiple views of the same error. As a result of user feedback we united the error and coverage reporting offering one holistic view.
As the launch date grew closer, we performed several larger scale experiments. We A/B tested some of the new Search Console reports against the existing reports with 30,000 users. We tracked issue fix rates to verify new Search Console drives better results and sent out follow-up surveys to learn about their experience. This most recent feedback confirmed that export functionality was not a nice-to-have, but rather a requirement for many users and helped us tune detailed help pages in the initial release.
We are happy to announce that the new Search Console is now available to all sites. Whether it is through Search Console’s feedback button or through the user panel, we truly value a collaborative design process, where all of our users can help us build the best product.
Try out the new search console.
We’re not finished yet! Which feature would you love to see in the next iteration of Search Console? Let us know below.
Posted by the Search Console UX team

Real-world data in PageSpeed Insights
PageSpeed Insights provides information about how well a page adheres to a set of best practices. In the past, these recommendations were presented without the context of how fast the page performed in the real world, which made it hard to understand when it was appropriate to apply these optimizations. Today, we’re announcing that PageSpeed Insights will use data from the Chrome User Experience Report to make better recommendations for developers and the optimization score has been tuned to be more aligned with the real-world data.
The PSI report now has several different elements:
- The Speed score categorizes a page as being Fast, Average, or Slow. This is determined by looking at the median value of two metrics: First Contentful Paint (FCP) and DOM Content Loaded (DCL). If both metrics are in the top one-third of their category, the page is considered fast.
- The Optimization score categorizes a page as being Good, Medium, or Low by estimating its performance headroom. The calculation assumes that a developer wants to keep the same appearance and functionality of the page.
- The Page Load Distributions section presents how this page’s FCP and DCL events are distributed in the data set. These events are categorized as Fast (top third), Average (middle third), and Slow (bottom third) by comparing to all events in the Chrome User Experience Report.
- The Page Stats section describes the round trips required to load the page’s render-blocking resources, the total bytes used by the page, and how it compares to the median number of round trips and bytes used in the dataset. It can indicate if the page might be faster if the developer modifies the appearance and functionality of the page.
- Optimization Suggestions is a list of best practices that could be applied to this page. If the page is fast, these suggestions are hidden by default, as the page is already in the top third of all pages in the data set.
For more details on these changes, see About PageSpeed Insights. As always, if you have any questions or feedback, please visit our forums and please remember to include the URL that is being evaluated.
Posted by Mushan Yang (杨沐杉) and Xiangyu Luo (罗翔宇), Software Engineers
Introducing the new Search Console
A few months ago we released a beta version of a new Search Console experience to a limited number of users. We are now starting to release this beta version to all users of Search Console, so that everyone can explore this simplified process of optimizing a website’s presence on Google Search. The functionality will include Search performance, Index Coverage, AMP status, and Job posting reports. We will send a message once your site is ready in the new Search Console.
We started by adding some of the most popular functionality in the new Search Console (which can now be used in your day-to-day flow of addressing these topics). We are not done yet, so over the course of the year the new Search Console (beta) will continue to add functionality from the classic Search Console. Until the new Search Console is complete, both versions will live side-by-side and will be easily interconnected via links in the navigation bar, so you can use both.
The new Search Console was rebuilt from the ground up by surfacing the most actionable insights and creating an interaction model which guides you through the process of fixing any pending issues. We’ve also added ability to share reports within your own organization in order to simplify internal collaboration.
Search Performance: with 16 months of data!
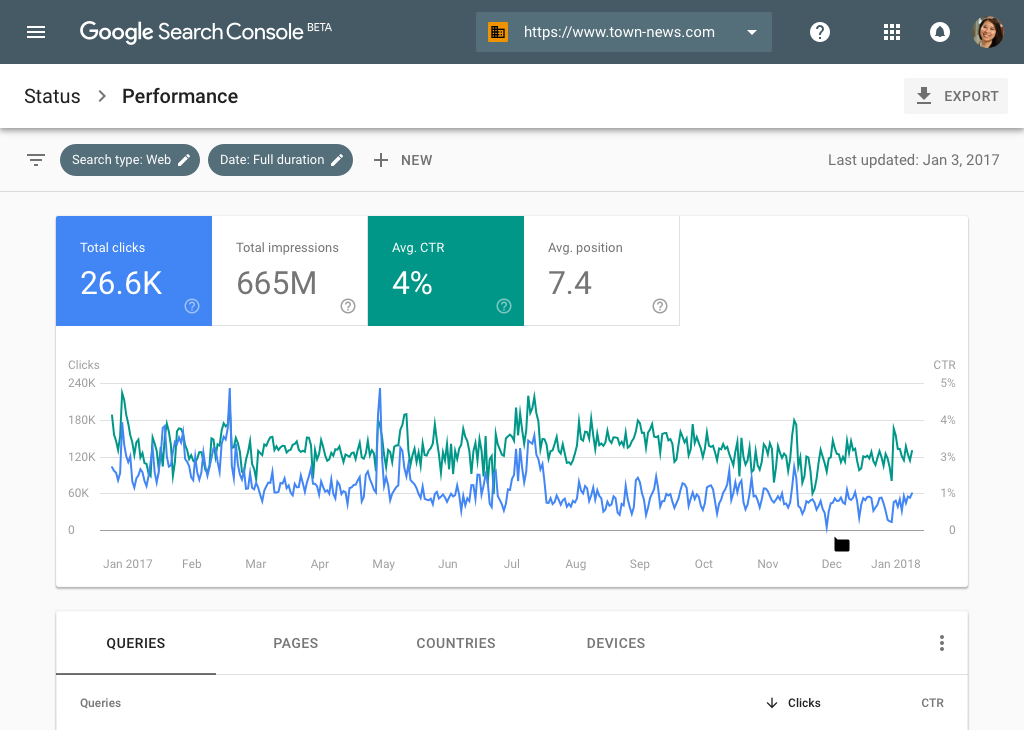
If you’ve been a fan of Search Analytics, you’ll love the new Search Performance report. Over the years, users have been consistent in asking us for more data in Search Analytics. With the new report, you’ll have 16 months of data, to make analyzing longer-term trends easier and enable year-over-year comparisons. In the near future, this data will also be available via the Search Console API.
Index Coverage: a comprehensive view on Google’s indexing

The updated Index Coverage report gives you insight into the indexing of URLs from your website. It shows correctly indexed URLs, warnings about potential issues, and reasons why Google isn’t indexing some URLs. The report is built on our new Issue tracking functionality that alerts you when new issues are detected and helps you monitor their fix.
So how does that work?
- When you drill down into a specific issue you will see a sample of URLs from your site. Clicking on error URLs brings up the page details with links to diagnostic-tools that help you understand what is the source of the problem.
- Fixing Search issues often involves multiple teams within a company. Giving the right people access to information about the current status, or about issues that have come up there, is critical to improving an implementation quickly. Now, within most reports in the new Search Console, you can do that with the share button on top of the report which will create a shareable link to the report. Once things are resolved, you can disable sharing just as easily.
- The new Search Console can also help you confirm that you’ve resolved an issue, and help us to update our index accordingly. To do this, select a flagged issue, and click validate fix. Google will then crawl and reprocess the affected URLs with a higher priority, helping your site to get back on track faster than ever.
- The Index Coverage report works best for sites that submit sitemap files. Sitemap files are a great way to let search engines know about new and updated URLs. Once you’ve submitted a sitemap file, you can now use the sitemap filter over the Index Coverage data, so that you’re able to focus on an exact list of URLs.
Search Enhancements: improve your AMP and Job Postings pages
The new Search Console is also aimed at helping you implement Search Enhancements such as AMP and Job Postings (more to come). These reports provide details into the specific errors and warnings that Google identified for these topics. In addition to the functionally described in the index coverage report, we augmented the reports with two extra features:
- The first feature is aimed at providing faster feedback in the process of fixing an issue. This is achieved by running several instantaneous tests once you click the validate fix button. If your pages don’t pass this test we provide you with an immediate notification, otherwise we go ahead and reprocess the rest of the affected pages.
- The second new feature is aimed at providing positive feedback during the fix process by expanding the validation log with a list of URLs that were identified as fixed (in addition to URLs that failed the validation or might still be pending).
Similar to the AMP report, the new Search Console provides a Job postings report. If you have jobs listings on your website, you may be eligible to have those shown directly through Google for Jobs (currently only available in certain locations).
Feedback welcome
We couldn’t have gotten so far without the ongoing feedback from our diligent trusted testers (we plan to share more on how their feedback helped us dramatically improve Search Console). However, your continued feedback is critical for us: if there’s something you find confusing or wrong, or if there’s something you really like, please let us know through the feedback feature in the sidebar. Also note that the mobile experience in the new Search Console is still a work in progress.
We want to end this blog sharing an encouraging response we got from a user who has been testing the new Search Console recently:
“The UX of new Search Console is clean and well laid out, everything is where we expect it to be. I can even kick-off validation of my fixes and get email notifications with the result. It’s been a massive help in fixing up some pesky AMP errors and warnings that were affecting pages on our site. On top of all this, the Search Analytics report now extends to 16 months of data which is a total game changer for us” – Noah Szubski, Chief Product Officer, DailyMail.com
Are there any other tools that would make your life as a webmaster easier? Let us know in the comments here, and feel free to jump into our webmaster help forums to discuss your ideas with others!
Posted by John Mueller, Ofir Roval and Hillel Maoz
Introducing the new Search Console
A few months ago we released a beta version of a new Search Console experience to a limited number of users. We are now starting to release this beta version to all users of Search Console, so that everyone can explore this simplified process of optimizing a website’s presence on Google Search. The functionality will include Search performance, Index Coverage, AMP status, and Job posting reports. We will send a message once your site is ready in the new Search Console.
We started by adding some of the most popular functionality in the new Search Console (which can now be used in your day-to-day flow of addressing these topics). We are not done yet, so over the course of the year the new Search Console (beta) will continue to add functionality from the classic Search Console. Until the new Search Console is complete, both versions will live side-by-side and will be easily interconnected via links in the navigation bar, so you can use both.
The new Search Console was rebuilt from the ground up by surfacing the most actionable insights and creating an interaction model which guides you through the process of fixing any pending issues. We’ve also added ability to share reports within your own organization in order to simplify internal collaboration.
Search Performance: with 16 months of data!
If you’ve been a fan of Search Analytics, you’ll love the new Search Performance report. Over the years, users have been consistent in asking us for more data in Search Analytics. With the new report, you’ll have 16 months of data, to make analyzing longer-term trends easier and enable year-over-year comparisons. In the near future, this data will also be available via the Search Console API.
Index Coverage: a comprehensive view on Google’s indexing
The updated Index Coverage report gives you insight into the indexing of URLs from your website. It shows correctly indexed URLs, warnings about potential issues, and reasons why Google isn’t indexing some URLs. The report is built on our new Issue tracking functionality
that alerts you when new issues are detected and helps you monitor their fix.
So how does that work?
- When you drill down into a specific issue you will see a sample of URLs from your site. Clicking on error URLs brings up the page details with links to diagnostic-tools that help you understand what is the source of the problem.
- Fixing Search issues often involves multiple teams within a company. Giving the right people access to information about the current status, or about issues that have come up there, is critical to improving an implementation quickly. Now, within most reports in the new Search Console, you can do that with the share button on top of the report which will create a shareable link to the report. Once things are resolved, you can disable sharing just as easily.
- The new Search Console can also help you confirm that you’ve resolved an issue, and help us to update our index accordingly. To do this, select a flagged issue, and click validate fix. Google will then crawl and reprocess the affected URLs with a higher priority, helping your site to get back on track faster than ever.
- The Index Coverage report works best for sites that submit sitemap files. Sitemap files are a great way to let search engines know about new and updated URLs. Once you’ve submitted a sitemap file, you can now use the sitemap filter over the Index Coverage data, so that you’re able to focus on an exact list of URLs.
Search Enhancements: improve your AMP and Job Postings pages
The new Search Console is also aimed at helping you implement Search Enhancements such as AMP and Job Postings (more to come). These reports provide details into the specific errors and warnings that Google identified for these topics. In addition to the functionally described in the index coverage report, we augmented the reports with two extra features:
- The first feature is aimed at providing faster feedback in the process of fixing an issue. This is achieved by running several instantaneous tests once you click the validate fix button. If your pages don’t pass this test we provide you with an immediate notification, otherwise we go ahead and reprocess the rest of the affected pages.
- The second new feature is aimed at providing positive feedback during the fix process by expanding the validation log with a list of URLs that were identified as fixed (in addition to URLs that failed the validation or might still be pending).
Similar to the AMP report, the new Search Console provides a Job postings report. If you have jobs listings on your website, you may be eligible to have those shown directly through Google for Jobs (currently only available in certain locations).
Feedback welcome
We couldn’t have gotten so far without the ongoing feedback from our diligent trusted testers (we plan to share more on how their feedback helped us dramatically improve Search Console). However, your continued feedback is critical for us: if there’s something you find confusing or wrong, or if there’s something you really like, please let us know through the feedback feature in the sidebar. Also note that the mobile experience in the new Search Console is still a work in progress.
We want to end this blog sharing an encouraging response we got from a user who has been testing the new Search Console recently:
“The UX of new Search Console is clean and well laid out, everything is where we expect it to be. I can even kick-off validation of my fixes and get email notifications with the result. It’s been a massive help in fixing up some pesky AMP errors and warnings that were affecting pages on our site. On top of all this, the Search Analytics report now extends to 16 months of data which is a total game changer for us” – Noah Szubski, Chief Product Officer, DailyMail.com
Are there any other tools that would make your life as a webmaster easier? Let us know in the comments here, and feel free to jump into our webmaster help forums to discuss your ideas with others!
Posted by John Mueller, Ofir Roval and Hillel Maoz
Introducing Rich Results & the Rich Results Testing Tool
Over the years, the different ways you can choose to highlight your website’s content in search has grown dramatically. In the past, we’ve called these rich snippets, rich cards, or enriched results. Going forward – to simplify the terminology – our documentation will use the name “rich results” for all of them. Additionally, we’re introducing a new rich results testing tool to make diagnosing your pages’ structured data easier.
The new testing tool focuses on the structured data types that are eligible to be shown as rich results. It allows you to test all data sources on your pages, such as JSON-LD (which we recommend), Microdata, or RDFa. The new tool provides a more accurate reflection of the page’s appearance on Search and includes improved handling for Structured Data found on dynamically loaded content. The tests for Recipes, Jobs, Movies, and Courses are currently supported — but this is just a first step, we plan on expanding over time.

Testing a page is easy: just open the testing tool, enter a URL, and review the output. If there are issues, the tool will highlight the invalid code in the page source. If you’re working with others on this page, the share-icon on the bottom-right lets you do that quickly. You can also use preview button to view all the different rich results the page is eligible for. And … once you’re happy with the result, use Submit To Google to fetch & index this page for search.
Want to get started with rich snippets rich results? Check out our guides for marking up your content. Feel free to drop by our Webmaster Help forums should you have any questions or get stuck; the awesome experts there can often help resolve issues and give you tips in no time!
Posted by Shachar Pooyae, Software Engineer
Introducing Rich Results & the Rich Results Testing Tool
Over the years, the different ways you can choose to highlight your website’s content in search has grown dramatically. In the past, we’ve called these rich snippets, rich cards, or enriched results. Going forward – to simplify the terminology – our documentation will use the name “rich results” for all of them. Additionally, we’re introducing a new rich results testing tool to make diagnosing your pages’ structured data easier.
The new testing tool focuses on the structured data types that are eligible to be shown as rich results. It allows you to test all data sources on your pages, such as JSON-LD (which we recommend), Microdata, or RDFa. The new tool provides a more accurate reflection of the page’s appearance on Search and includes improved handling for Structured Data found on dynamically loaded content. The tests for Recipes, Jobs, Movies, and Courses are currently supported — but this is just a first step, we plan on expanding over time.
Testing a page is easy: just open the testing tool, enter a URL, and review the output. If there are issues, the tool will highlight the invalid code in the page source. If you’re working with others on this page, the share-icon on the bottom-right lets you do that quickly. You can also use preview button to view all the different rich results the page is eligible for. And … once you’re happy with the result, use Submit To Google to fetch & index this page for search.
Want to get started with rich snippets rich results? Check out our guides for marking up your content. Feel free to drop by our Webmaster Help forums should you have any questions or get stuck; the awesome experts there can often help resolve issues and give you tips in no time!
Posted by Shachar Pooyae, Software Engineer
SEO basics: what are user signals?
If you’re an SEO-newbie you’ll probably hear lots of new and complicated terms. In our SEO basics-series, we’ll explain all these terms and concepts to you. In this post, I’ll go into user signals. What exactly are user signals? And what do user signals have to do with SEO? What do you need to know […]
The post SEO basics: what are user signals? appeared first on Yoast.
Ask Yoast: why connect GSC with Yoast SEO?
If you use our Yoast SEO plugin you’ve got the opportunity to connect it to Google Search Console (GSC). With GSC you can monitor the SEO health of your site, while Yoast SEO helps you to optimize your site. Connecting the two, so they can work together, will allow you to be more efficient when maintaining your site. […]
Deprecation of the old Webmaster Tools API
Last fall we announced the new Webmaster Tools API, which helps you to automate a number of important aspects using code. With the pending shutdown of ClientLogin, we’re going to turn down the old Webmaster Tools API on April 20, 2015. If you’re…
Bing Webmaster Tools: Security, Widgets and Messages
Compared to the first three sections, the last three are relatively small. In this final post in our series on Bing Webmaster Tools we will go over Security, Malware and Messages and share our findings. Security Making sure your website is secure is of course really important. We have already emphasized this on our page on WordPress security,…
This post first appeared as Bing Webmaster Tools: Security, Widgets and Messages on Yoast. Whoopity Doo!
Unblocking resources with Webmaster Tools
Webmasters often use linked images, CSS, and JavaScript files in web pages to make them pretty and functional. If these resources are blocked from crawling, then Googlebot can’t use them when it renders those pages for search. Google Webmaster Tools no…
Bing Webmaster Tools: Diagnostics & Tools
Bing Webmaster Tools provides a number of tools to analyze your website. Somehow, they managed to squeeze these into one page in Bing Webmaster Tools as the dashboard page for the section Diagnostics & Tools. Fortunately, all tools also have a separate page… In this post, we will go over all tools and tell you how…
This post first appeared as Bing Webmaster Tools: Diagnostics & Tools on Yoast. Whoopity Doo!
Bing Webmaster Tools: Reports and Data
In this second Bing Webmaster Tools post in our series on Webmaster Tools, the focus is on reporting. We’ll be going over a number of pages, and try to explain what information is available and how this can help you improve your website. Or get new insights about your audience, of course. This section is…
This post first appeared as Bing Webmaster Tools: Reports and Data on Yoast. Whoopity Doo!
Bing Webmaster Tools: Configure My Site
We recently did a series about Google Webmaster Tools. So we thought it was time to do a series about Bing Webmaster Tools as well. Bing isn’t that big in The Netherlands, or Europe, for that matter, but it still holds some ground in the US. The most important reason, however, is we think Bing Webmaster…
This post first appeared as Bing Webmaster Tools: Configure My Site on Yoast. Whoopity Doo!
Google Webmaster Tools: Crawl
The section in Google Webmaster Tools that works most closely with our WordPress SEO Premium plugin, is the Crawl section. In our premium plugin, you’ll find a Webmaster Tools section, that lists all pages Google somehow did not find on your website. You can easily import these into the plugin and redirect the ones that…
This post first appeared on Yoast. Whoopity Doo!
Google Webmaster Tools: Google Index
This is already the third post in our Google Webmaster Tools series. Last week we’ve written about the Search Appearance section and the Search Traffic section of Google Webmaster Tools. So if you jumped in here, and want to start at the beginning, please read those posts first. Today we’ll be going into the Google…
This post first appeared on Yoast. Whoopity Doo!
Google Webmaster Tools: Search Traffic
Following Thijs’ article on Search Appearance in Google Webmaster Tools, I wanted to talk to you today about the second section: Search Traffic. Although the common thread is search traffic, the subsection deal with a lot of different topics like search queries and links. In this article, we will explain all that can be found in these…
This post first appeared on Yoast. Whoopity Doo!
Google Webmaster Tools: Search Appearance
There are a lot of ways to check how your website’s doing these days. The most common one people use is probably Google Analytics. Google Analytics is definitely a great tool for monitoring your site. However, since the ‘not provided’ development, it’s become pretty hard to monitor your SEO efforts. And unfortunately, most tools that…
This post first appeared on Yoast. Whoopity Doo!
The four steps to appiness
Webmaster Level: intermediate to advanced
App deep links are the new kid on the block in organic search, and they’re picking up speed faster than you can say “schema.org ViewAction”! For signed-in users, 15% of Google searches on Android now return deep links to apps through App Indexing. And over just the past quarter, we’ve seen the number of clicks on app deep links jump by 10x.
We’ve gotten a lot of feedback from developers and seen a lot of implementations gone right and others that were good learning experiences since we opened up App Indexing back in June. We’d like to share with you four key steps to monitor app performance and drive user engagement:
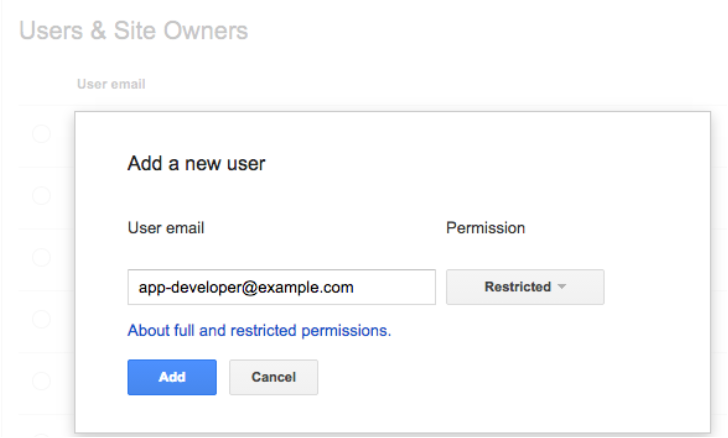
1. Give your app developer access to Webmaster Tools
App indexing is a team effort between you (as a webmaster) and your app development team. We show information in Webmaster Tools that is key for your app developers to do their job well. Here’s what’s available right now:
- Errors in indexed pages within apps
- Weekly clicks and impressions from app deep link via Google search
- Stats on your sitemap (if that’s how you implemented the app deep links)
…and we plan to add a lot more in the coming months!
We’ve noticed that very few developers have access to Webmaster Tools. So if you want your app development team to get all of the information they need to fix app-related issues, it’s essential for them to have access to Webmaster Tools.
Any verified site owner can add a new user. Pick restricted or full permissions, depending on the level of access you’d like to give:
2. Understand how your app is doing in search results
How are users engaging with your app from search results? We’ve introduced two new ways for you to track performance for your app deep links:
- We now send a weekly clicks and impressions update to the Message center in your Webmaster Tools account.
- You can now track how much traffic app deep links drive to your app using referrer information – specifically, the referrer extra in the ACTION_VIEW intent. We’re working to integrate this information with Google Analytics for even easier access. Learn how to track referrer information on our Developer site.
3. Make sure key app resources can be crawled
Blocked resources are one of the top reasons for the “content mismatch” errors you see in Webmaster Tools’ Crawl Errors report. We need access to all the resources necessary to render your app page. This allows us to assess whether your associated web page has the same content as your app page.
To help you find and fix these issues, we now show you the specific resources we can’t access that are critical for rendering your app page. If you see a content mismatch error for your app, look out for the list of blocked resources in “Step 5” of the details dialog:

4. Watch out for Android App errors
To help you identify errors when indexing your app, we’ll send you messages for all app errors we detect, and will also display most of them in the “Android apps” tab of the Crawl errors report.
In addition to the currently available “Content mismatch” and “Intent URI not supported” error alerts, we’re introducing three new error types:
- APK not found: we can’t find the package corresponding to the app.
- No first-click free: the link to your app does not lead directly to the content, but requires login to access.
- Back button violation: after following the link to your app, the back button did not return to search results.
In our experience, the majority of errors are usually caused by a general setting in your app (e.g. a blocked resource, or a region picker that pops up when the user tries to open the app from search). Taking care of that generally resolves it for all involved URIs.
Good luck in the pursuit of appiness! As always, if you have questions, feel free to drop by our Webmaster help forum.
Posted by Mariya Moeva, Webmaster Trends Analyst