This article will dissect what the Google internal Content Warehouse API documentation leak in March 2024 tells us about Google’s real priorities, specifically focusing on how it reframes our understanding of Core Web Vitals (CWV).
We will explore how these public-facing metrics are the tip of a very large iceberg – an iceberg composed of deep user behaviour analysis, powerful click-based re-ranking systems, and a vast collection of data points that go far beyond what Google publicly discusses.
My own work has long focused on the critical importance of website speed.
The data is unequivocal: 53% of mobile visits are abandoned if a page takes longer than three seconds to load.
The principles behind Core Web Vitals are not new to me or my readers; they are simply the quantification of a user-first philosophy SEOs like me have long advocated.
The leak doesn’t change the entire strategy; it just gives us a rare glimpse at the engineering schematics that power it.
It confirms that the focus must shift from attempting to please a secretive machine to demonstrably satisfying a now-quantifiable human user.
Deconstructing Core Web Vitals: A Brief History of Quantifying ‘Delight’
Google’s journey toward measuring user experience has been a long and evolutionary one.
It didn’t begin with Core Web Vitals. Its roots can be traced back to major quality updates like Panda in 2011, which aimed to demote low-quality content – a principle the leak confirms still influences current algorithms. This was followed by more explicit moves, such as making site security (HTTPS) a signal in 2014 and the mobile Page Speed update in 2018.
This culminated in the formal announcement of Core Web Vitals in May 2020, a key component of what Google called the “Page Experience Update“. For the first time, Google provided a defined set of “real-world, user-centred metrics that quantify key aspects of the user experience”. The goal was to measure the “delightfulness” of a web page, moving beyond simple load times to capture a more holistic view of a user’s interaction.
The Google Content Data Warehouse Api leak contains references to both mobileCwv and desktopCwv and is explicitly used for “ranking changes,” cementing the direct connection between these metrics and ranking outcomes. For mobile specific research see my article: The Definitive Guide to Mobile SEO.
A critical part of this history is the evolution of the metrics themselves, which demonstrates Google’s refining understanding of user experience. On 12 March 2024, Google officially replaced First Input Delay (FID) with Interaction to Next Paint (INP) as the core responsiveness metric.
This was a hugely significant change.
FID was a limited metric; it measured only the input delay of the first interaction a user had with a page. A site could pass the FID test with flying colours but still be sluggish and unresponsive for every subsequent interaction.
INP provides a far more comprehensive and meaningful measure. It assesses a page’s overall responsiveness by observing the latency of all click, tap, and keyboard interactions throughout the entire user session, reporting the longest interaction observed (while ignoring outliers).
This shift is crucial because it aligns with Chrome usage data showing that 90% of a user’s time on a page is spent after it loads. The change from FID to INP signals a strategic move by Google from measuring an isolated page load event to evaluating the quality of the entire user journey. It creates a technical performance metric that more closely mirrors genuine user satisfaction—or frustration.
The Current Core Web Vitals Explained
Today, the Core Web Vitals consist of three specific metrics, each measuring a distinct facet of the user experience. To pass the overall assessment, a page must meet the “Good” threshold for all three, measured at the 75th percentile of page loads. This means that at least three out of every four users visiting your page should have an experience that meets the ‘Good’ benchmark.
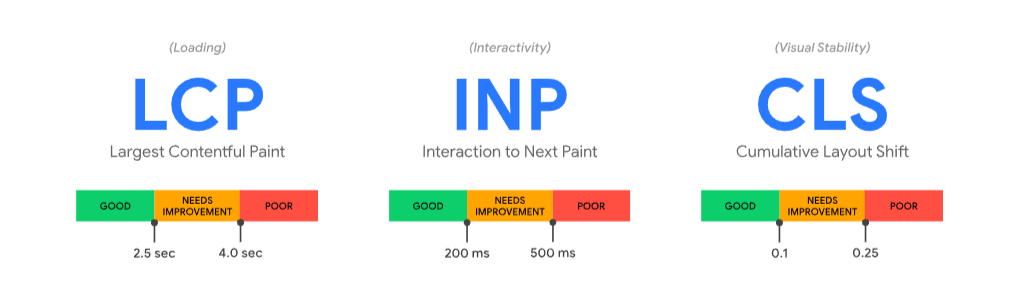
- Largest Contentful Paint (LCP): This measures the perceived loading performance. Specifically, it marks the point in the page load timeline when the largest image or text block visible within the viewport is rendered. A fast LCP reassures the user that the page is useful and actually loading.
- Interaction to Next Paint (INP): This measures the page’s overall responsiveness to user interactions. It captures the latency from when a user clicks, taps, or types until the next frame is painted, reflecting the visual feedback that the action has been registered.
- Cumulative Layout Shift (CLS): This measures visual stability. It quantifies how often users experience unexpected layout shifts, where elements on the page move around as it loads. A low CLS ensures the experience is smooth and not frustrating.
The table below summarises the current metrics and their performance thresholds as defined by Google.
Here’s the corrected and properly formatted table:
| Metric | What it Measures | Good | Needs Improvement | Poor |
|---|---|---|---|---|
| LCP | Perceived loading speed | ≤ 2.5s | > 2.5s and ≤ 4s | > 4s |
| INP | Overall page responsiveness | ≤ 200ms | > 200ms and ≤ 500ms | > 500ms |
| CLS | Visual stability of the page | ≤ 0.1 | > 0.1 and ≤ 0.25 | > 0.25 |
The Leak’s Corroboration: Finding UX Signals in the Code
While LCP, INP, and CLS are the public metrics we are told to optimise for, the Content Warehouse API leak reveals that Google’s internal systems for measuring the underlying principles of user experience are far more direct and extensive.
The documentation confirms long-held theories and exposes the raw data points that CWV scores are, in effect, a proxy for.
The Ranking Pipeline: A Multi-Stage Process
The leak, corroborated by testimony from the DOJ v. Google antitrust trial, dismantles the myth of a single “Google Algorithm,” revealing instead a multi-layered processing pipeline. A page must successfully pass through a series of evaluation gates to rank.
The initial scoring is handled by a core system named Mustang, which evaluates foundational on-page factors. After this, the NavBoost system—using a rolling 13-month window of user click data—re-ranks results based on user behaviour. Finally, a layer of re-ranking functions called “Twiddlers” provides final editorial control, boosting content for things like freshness (FreshnessTwiddler) or quality (QualityBoost), or applying demotions.
This pipeline extends beyond traditional blue links. A parallel system named Glue uses user interaction data to rank universal search features like video carousels and knowledge panels. A final system called Tangram then assembles all these elements onto the search results page. This architecture proves that SEO is not about optimising for a single score, but about ensuring a page and its associated assets provide a satisfying experience at each distinct stage.
Chrome as a Direct Data Source
For years, Google spokespeople have publicly dodged or denied confirming using data from the Chrome browser for ranking purposes.
The leak suggests this is, at best, a semantic simplification.
The documentation explicitly references a module named chrome-api-data and contains attributes that are direct measures of site-wide engagement from Chrome users, such as chromeInTotal (total site views from Chrome) and siteClicks.
Most critically for our discussion, it includes an attribute called time-to-first-byte-per-doc.
Time to First Byte (TTFB) is a foundational server response metric; it measures how long it takes for a browser to receive the first byte of data from the server.
It is a precursor to every other speed metric and has a direct impact on LCP. The leak strongly implies that Google collects this performance data directly via Chrome, giving its systems near real-time performance insights long before that data is aggregated and anonymised for the public Chrome User Experience Report (CrUX).
NavBoost: The Ultimate User Experience Feedback Loop
Perhaps the most significant revelation related to user experience is the extensive detail on a system called NavBoost. While its existence was confirmed in the DOJ antitrust trial, the leak provides the technical specifics. The documentation describes it as “one of Google’s strongest ranking signals” and confirms it uses aggregated click data from user search journeys to re-rank results.
The system stores metrics that are unambiguous measures of user satisfaction, including:
goodClicksbadClickslastLongestClicksunsquashedClicks
These attributes represent a powerful feedback loop. When a user clicks a result and then quickly returns to the search page (a behaviour known as “pogo-sticking”), that is a classic badClick.
It signals to Google that the page did not satisfy the user’s intent. Conversely, a lastLongestClick indicates the user found what they were looking for and ended their search journey on that page—a strong signal of satisfaction. The documentation also references a SERP Demotion attribute, a direct signal for demotion based on user dissatisfaction observed on the search results page, likely measured by these very click patterns.
The connection to Core Web Vitals here is direct and causal. A poor technical experience is a leading cause of negative behavioural signals. Imagine a user clicks on your page. If it’s slow to load (poor LCP) and the layout shifts just as they try to tap a button (poor CLS), they will become frustrated and immediately click back.
This action is logged by NavBoost as a badClick. Core Web Vitals can therefore be understood as a preventative measure. By optimising for CWV, we are proactively improving the technical user experience to avoid triggering the negative behavioural flags that are measured by far more powerful and direct ranking systems like NavBoost. A good CWV score isn’t just about passing a test; it’s about preventing the negative user behaviour that these confirmed, high-impact systems are designed to detect and penalise.
Direct Evidence of CWV in the Content Warehouse
Further cementing the importance of these metrics, the leak contains a specific model dedicated to storing Core Web Vitals data: GoogleApi.ContentWarehouse.V1.Model.IndexingMobileVoltCoreWebVitals. The documentation describes this as carrying the “field data metrics extracted from UKM aggregated 75-percentile data”. This is a direct confirmation that the very same 75th percentile field data we see in public CrUX reports is ingested and stored as a core attribute for mobile documents.
The model explicitly lists attributes for the key metrics:
lcp(Largest Contentful Paint)inp(Interaction to Next Paint)cls(Cumulative Layout Shift)fid(First Input Delay)
Interestingly, the model includes an attribute for fid, the now-deprecated First Input Delay.
Its presence suggests that even as public-facing metrics evolve, Google may retain historical data points for internal analysis and comparison, or that parts of the documentation reflect a snapshot in time during the transition to INP.
CWV Data Explicitly Used for Ranking Changes
The connection is made even more explicit with another model found in the leak: GoogleApi.ContentWarehouse.V1.Model.IndexingMobileVoltVoltPerDocData. The description for this module is unambiguous, stating it is a protocol buffer where “The data is used for ranking changes.”
This model acts as a container for the page experience signals that are directly actioned for ranking. The documentation clarifies that “Only CWV signals and secure signal are stored” in this particular buffer, while other factors like MobileFriendliness are stored separately.
The attributes within this model include:
mobileCwv: This contains the mobile Core Web Vitals metrics, using theIndexingMobileVoltCoreWebVitalsmodel we just discussed.desktopCwv: This contains the desktop Core Web Vitals metrics.displayUrlIsHttps: A boolean flag indicating if the page is served securely via HTTPS.
This finding is critical. It moves beyond simply confirming that Google stores CWV data and provides direct evidence of a specific data structure whose stated purpose is to use Core Web Vitals and HTTPS status for “ranking changes”.
Page Structure and Content Effort Signals
The leak also confirms that Google’s systems understand the anatomy of a webpage with remarkable granularity. An attribute named pageregions indicates that Google encodes the positional ranges for different parts of a document, such as the header, footer, and main content. This strongly implies that content and links within the main body are valued more highly than those in boilerplate sections, directly impacting how signals like LCP (which often occur in the main content) are contextualised.
Furthermore, the documentation reveals that Google tracks the average weighted font size of terms, suggesting that words visually emphasised in headings or through bolding are given more weight. The documentation also reveals that core ranking systems like Mustang have a maximum number of tokens (words) they will process for a given page. This implies that extremely long content may be truncated, reinforcing the importance of placing the most critical information early in the document.
Most strategically, an attribute called contentEffort appears to be the technical foundation of the “Helpful Content System.” Described as an “LLM-based effort estimation,” this score likely quantifies the human effort invested in creating a piece of content, algorithmically separating high-value, original work from generic, easily replicated articles.
CWV in the Quality Ecosystem: Beyond the Metrics
Core Web Vitals do not exist in a vacuum. They are a prominent component of a broader constellation of signals that Google’s core ranking systems use to evaluate the overall “Page Experience”. This framework also includes established factors like:
- HTTPS: Whether the page is served securely.
- Mobile-friendliness: Whether the content displays and functions well on mobile devices.
- No Intrusive Interstitials: Avoiding pop-ups and other elements that obscure the main content and degrade the user experience.
Within this group, CWV represents the most technically complex and dynamic set of signals, requiring ongoing attention.
Site-Wide Quality Score (Q*)
The DOJ trial also confirmed the existence of a site-wide quality score, internally designated as Q* (pronounced “Q-star”).
This largely static, query-independent score functions as a domain authority metric, influencing the ranking potential of all pages on a site. The original PageRank algorithm is now understood to be just one of several inputs into this broader Q* signal.
A poor site-wide quality score can limit the performance of even the best individual pages, reinforcing the idea that page experience signals like Core Web Vitals contribute to a holistic assessment of a domain’s overall trustworthiness and quality.
A Sophisticated View of Freshness
The leak reveals that Google’s understanding of “freshness” is far more advanced than simply looking at a publication date. The system uses a trio of attributes to build a comprehensive picture of a document’s timeliness:
bylineDate: The date is explicitly stated on the page.syntacticDate: A date extracted from the URL string or the page’s title.semanticDate: A date derived from the content itself, evaluating if the information and sources are up-to-date relative to the topic.
This multi-faceted approach is a clear defence against “freshness spam,” where a publisher might simply change the byline date without updating the content. True quality requires updating the core substance of the information, not just the metadata.
Connecting to the Quality Rater Guidelines (QRG)
There is also a crucial, though indirect, link between the automated, quantitative data of Core Web Vitals and the human-centric, qualitative assessments outlined in Google’s Quality Rater Guidelines. While the QRG does not instruct its human raters to run a PageSpeed Insights test, the principles are deeply intertwined.
A page that fails Core Web Vitals will almost certainly be judged as having a low-quality user experience by a human rater.
Consider the core tenets of the QRG. Raters are asked to assess the Main Content (MC) of a page and evaluate its Expertise, Authoritativeness, and Trustworthiness (E-A-T, now expanded to E-E-A-T to include Experience).
A poor technical experience fundamentally undermines this assessment:
- A high LCP prevents a rater from quickly accessing the MC to evaluate its purpose and quality in the first place.
- A high CLS creates a jarring, frustrating, and unprofessional experience. This directly erodes the “Trustworthiness” pillar of E-E-A-T. A website that feels broken is not a trustworthy one.
- A high INP makes a page feel unresponsive and unusable, leading a rater to assign a very low Page Quality (PQ) rating.
Tellingly, recent versions of the guidelines reportedly require human raters to disable ad blockers during their evaluations.
This ensures they see the full, unfiltered user experience, including the impact of advertisements on usability – a factor that can directly influence CLS and INP.
This provides a direct link between the human evaluation of a technically disruptive experience and the data used to train Google’s core algorithms.
Page Experience, with CWV at its core, acts as a foundational “trust gateway”.
A technically poor site creates so much friction that it prevents its content, no matter how expert or well-researched, from being perceived as trustworthy or helpful. You cannot effectively demonstrate your E-E-A-T if the user abandons your page in frustration before they can even consume your content.
CWV and the Helpful Content System
This connection is made even more explicit in Google’s guidance on its Helpful Content System.
Google’s documentation states, “Helpful content generally offers a good page experience“. In the era of the Helpful Content Update (HCU), where Google aims to reward content made “by people, for people”, a poor page experience is a strong signal that a site is not, in fact, “people-first”.
A website that is frustratingly slow, unstable, or difficult to use cannot be considered truly helpful, regardless of the quality of the text on the page.
The leak’s revelation of the contentEffort attribute provides the likely technical underpinning for this system, algorithmically scoring the level of effort and originality in content.
The Great Debate: How Much Do Core Web Vitals Really Matter for Ranking?
This is perhaps the most contentious question surrounding Core Web Vitals. The SEO industry has been awash with conflicting reports and interpretations. To get to the truth, we must look at what Google has said directly and then reconcile those statements with the evidence from the leak.
The Official Narrative
Google’s official position has always been nuanced. A spokesperson once stated that while page experience is important, Google will “prioritise pages with the best information overall, even if some aspects of page experience are subpar”. They clarified, “A good page experience does not override having great, relevant content.
However, in cases where there are multiple pages that have similar content, page experience becomes much more important for visibility in Search.”
Google’s Search Advocate, John Mueller, has provided even more specific commentary.
On one hand, he has stated that CWV is “more than a tie-breaker”. On the other, he has repeatedly sought to manage expectations, stating on LinkedIn, “We’ve been pretty clear that Core Web Vitals are not giant factors in ranking, and I doubt you’d see a big drop just because of that.”
My Analysis: Reconciling the Leak with Public Statements
So, how do we square this with the leak’s revelation of powerful, experience-driven systems like NavBoost?
I believe John Mueller is being precise in his language. The direct ranking signal applied from the three public CWV metrics themselves may indeed be a relatively small, lightweight factor within the initial Mustang scoring system.
It is not a “giant factor” in the same way that the relevance of your content to the query is.
However, this view is incomplete. The leak confirms that the underlying user experience principles that CWV represent are measured and actioned by other, extremely powerful systems in the ranking pipeline.
As we’ve discussed, poor CWV scores lead directly to the negative behavioural signals (like badClicks) that a major re-ranking system like NavBoost is designed to penalise.
Therefore, my conclusion is this: ignoring Core Web Vitals because the direct ranking signal is “not giant” is a critical strategic error.
CWV is a foundational element of a high-quality website. It will not make bad content rank well. But poor CWV will absolutely cause your great content to be outranked by a competitor whose content is of similar quality but is delivered with a better user experience.
The Business Case Beyond Rankings
Ultimately, the debate over ranking factor weight misses the bigger picture.
Even if Core Web Vitals had zero impact on rankings, they would still be a critical priority for any serious business. The impact on user behaviour and conversions is undeniable.
Data I’ve compiled on my own site and from industry studies tells a clear story:
- When a site meets the recommended CWV thresholds, users are at least 24% less likely to abandon the page before it even loads.
- Every 100ms improvement in load time can lift conversion rates by over 1%.
- Publishers with mobile load times of 5 seconds can earn up to 2x more mobile ad revenue than those with 19-second load times.
The business case is overwhelming.
As John Mueller himself rightly pointed out, “…if users are so annoyed that they don’t want to come back, you’re just wasting the first-time visitors to your site, regardless of where they come from.” Optimising for Core Web Vitals is not just about pleasing Google; it’s about respecting your users’ time and maximising the value of every single visit.
The SEO’s Toolkit: Measuring, Monitoring, and Improving CWV
Effectively managing Core Web Vitals requires understanding the tools at your disposal and, most importantly, the type of data they provide.
Lab Data vs. Field Data: The Critical Distinction
This is the most important concept to grasp in CWV testing.
- Field Data: This is also known as Real User Monitoring (RUM). It is performance data collected from actual Chrome users who have opted-in to sharing anonymised browsing data. This data is compiled into the Chrome User Experience Report (CrUX). This is the data Google uses for ranking. It is typically presented as a 28-day rolling average, so changes you make today will take time to be reflected.
- Lab Data: This is a synthetic test run in a controlled, simulated environment. It uses a specific device and network connection to analyse a page. Lab data is excellent for debugging, identifying performance bottlenecks, and testing the impact of changes before you deploy them. However, it does not directly impact your rankings.
Essential Google Tools
Google provides a suite of free tools that are indispensable for any SEO.
- PageSpeed Insights: This is the go-to tool for most. It conveniently presents both Field data from the CrUX report (if your site has sufficient traffic) and a detailed Lab test run via Lighthouse. It also provides actionable recommendations for improvement.
- Google Search Console: The Core Web Vitals report within Search Console is essential for monitoring your site’s performance at scale. It groups URLs with similar issues, allowing you to see trends over time and track your progress after implementing fixes.
- Chrome DevTools and Lighthouse: These tools are integrated directly into the Chrome browser. They are powerful resources for developers to run on-demand Lab tests, dive deep into performance waterfalls, and debug issues in real-time. The “Performance” panel is particularly useful for diagnosing the causes of poor INP.
Third-Party and Integrated Tools
A rich ecosystem of third-party tools like WebPageTest and GTmetrix also exists, offering more advanced features such as testing from different global locations, on a wider variety of devices, or with custom connection speeds.
For those of us managing multiple clients, integrating these checks into a consistent workflow is key.
That’s why the Hobo SEO Dashboard automatically pulls in performance metrics, including CWV data from the API, into the ‘Domain Stats’ tab, giving a quick, consistent technical health check across all top-performing pages without having to run manual tests for every site.
Conclusion: From Chasing Scores to Building Better Experiences
The 2024 Google Content Warehouse API leak did not provide a simple cheat sheet of ranking factors. It delivered something far more valuable: confirmation. It confirms that Google’s internal architecture is deeply and fundamentally aligned with measuring and rewarding genuine user satisfaction.
The complex systems revealed in the documentation, from the multi-stage ranking pipeline to specific attributes like contentEffort, are designed to interpret user behaviour and content quality as a direct proxy for utility.
In this context, we must see Core Web Vitals not as an arbitrary set of scores to be chased for their own sake, but as an essential, standardised diagnostic toolkit. The goal is not to achieve a perfect score of 100 in Lighthouse simply to please a machine. The goal is to use these metrics to identify and eliminate the technical friction that prevents real human users from having a fast, stable, and responsive experience on your website.
The strategy that will stand the test of time — the one that is truly future-proof – is to focus on building a genuinely better web experience. The specific metrics may evolve again, just as FID evolved into the more sophisticated INP. But the underlying principle of serving the user well will remain a constant. The leak proves that this isn’t just a fluffy guideline from a webmaster blog; it is a principle that is hardwired into the very core of Google’s systems.
For more, see the following:
- Largest Contentful Paint (LCP): measures loading performance. To provide a good user experience, LCP should occur within 2.5 seconds of when the page first starts loading.
- Interaction to Next Paint (INP): measures interactivity. To provide a good user experience, pages should have a INP of 200 milliseconds or less.
- Cumulative Layout Shift (CLS): measures visual stability. To provide a good user experience, pages should maintain a CLS of 0.1. or less.
References
- Akamai. (n.d.). What Are Google Core Web Vitals? Akamai.
- Anderson, S. (2024, September 22). SEO tutorial for beginners. Hobo Web.
- Anderson, S. (n.d.). The Domain Stats Tab in Hobo SEO Dashboard in Google Sheets. Hobo Web.
- Anderson, S. (n.d.). The Google Content Warehouse Leak 2024. Hobo Web.
- Anderson, S. (n.d.). The SEO Audit Tab in Hobo SEO Dashboard. Hobo Web.
- Anderson, S. (n.d.). Your website design should load in 4 seconds. Hobo Web.
- B9Solution. (n.d.). Understanding Google’s Core Web Vitals’ Impact on SEO Rankings. B9Solution.
- DebugBear. (n.d.). Measure And Optimize Google Core Web Vitals: A Guide. DebugBear.
- DebugBear. (n.d.). Test Core Web Vitals. DebugBear.
- Deanlong.io. (n.d.). Page Speed is Not a Big Ranking Factor.
- Dynatrace. (n.d.). Why Core Web Vitals are crucial for optimizing digital experience. Dynatrace.
- Enge, E. (2021, December 15). What Is the Impact of Core Web Vitals on Ranking?. Perficient.
- EXPERTE.com. (n.d.). Bulk Core Web Vitals Check. EXPERTE.com.
- Google Search Central. (n.d.). Core Web Vitals report. Google.
- Google Search Central. (n.d.). Evaluating page experience for a better web. Google.
- Google Search Central. (n.d.). Page experience in Google Search results. Google.
- GTmetrix. (n.d.). Website Performance Testing and Monitoring. GTmetrix.
- HostingAdvice. (n.d.). Website Load Time and Speed Statistics. HostingAdvice.
- Inbound Design Partners. (n.d.). Why Core Web Vitals May Not Matter As Much As You Think.
- King, M. (2024, May 27). Secrets from the Algorithm: Google Search’s Internal Engineering Documentation Has Leaked. iPullRank.
- Mediavine. (n.d.). Core Web Vitals Podcast Transcript. Mediavine.
- Media Group Worldwide. (n.d.). Google Core Web Vitals Update.
- Nestify. (2024, June 21). The Evolution of Core Web Vitals. Nestify.
- Nitropack. (n.d.). Core Web Vitals: A Full Guide on What They Are and How to Optimize Them. Nitropack.
- Nostra.ai. (n.d.). Google’s Core Web Vitals And Why You Should Improve Them: A Basic Introduction.
- Onely. (n.d.). Google’s Quality Rater Guidelines: A Practical Guide for SEOs. Onely.
- OuterBox. (2025, September 18). The Impact of Google’s Core Web Vitals on SEO. OuterBox.
- Punith. (n.d.). Core Web Vitals History. Punits.dev.
- Redevolution. (n.d.). Everything You Need To Know About Core Web Vitals.
- Resolution Digital. (n.d.). Google API Leak: Top SEO Recommendations.
- Rumvision. (n.d.). Get your website’s instant CoreWeb Vitals history. Rumvision.
- Samuelschmitt.com. (n.d.). 13 Free Tools to Test and Measure the Core Web Vitals.
- Search Engine Roundtable. (2023, December 1). Google Says Doubtful You’d See Big Ranking Drop Over Core Web Vitals Issues.
- Sematext. (n.d.). Top Tools for Core Web Vitals Testing and Monitoring. Sematext.
- Smith, C. (2025, September 18). The Impact of Google’s Core Web Vitals on SEO. OuterBox.
- Twaino. (n.d.). Hobo Web: The blog for learning SEO. Twaino.
- uSERP. (n.d.). Google Says Core Web Vitals Effect On Search Rankings Is Minimal.
- Uptrends. (n.d.). Free Core Web Vitals Test. Uptrends.
- Various Authors. (n.d.). How much do core web vitals matter for seo?. Reddit.
- Web.dev. (n.d.). Core Web Vitals.
- WebPageTest. (n.d.). From Fully Loaded to Core Web Vitals: Understanding the Evolution of Performance Metrics.
- WooRank. (n.d.). Core Web Vitals: How We Got Here. WooRank.
- Zaccone, M. (n.d.). Google API Leak: A Comprehensive Review and Guidance for SEOs. Marketing AI Institute.